
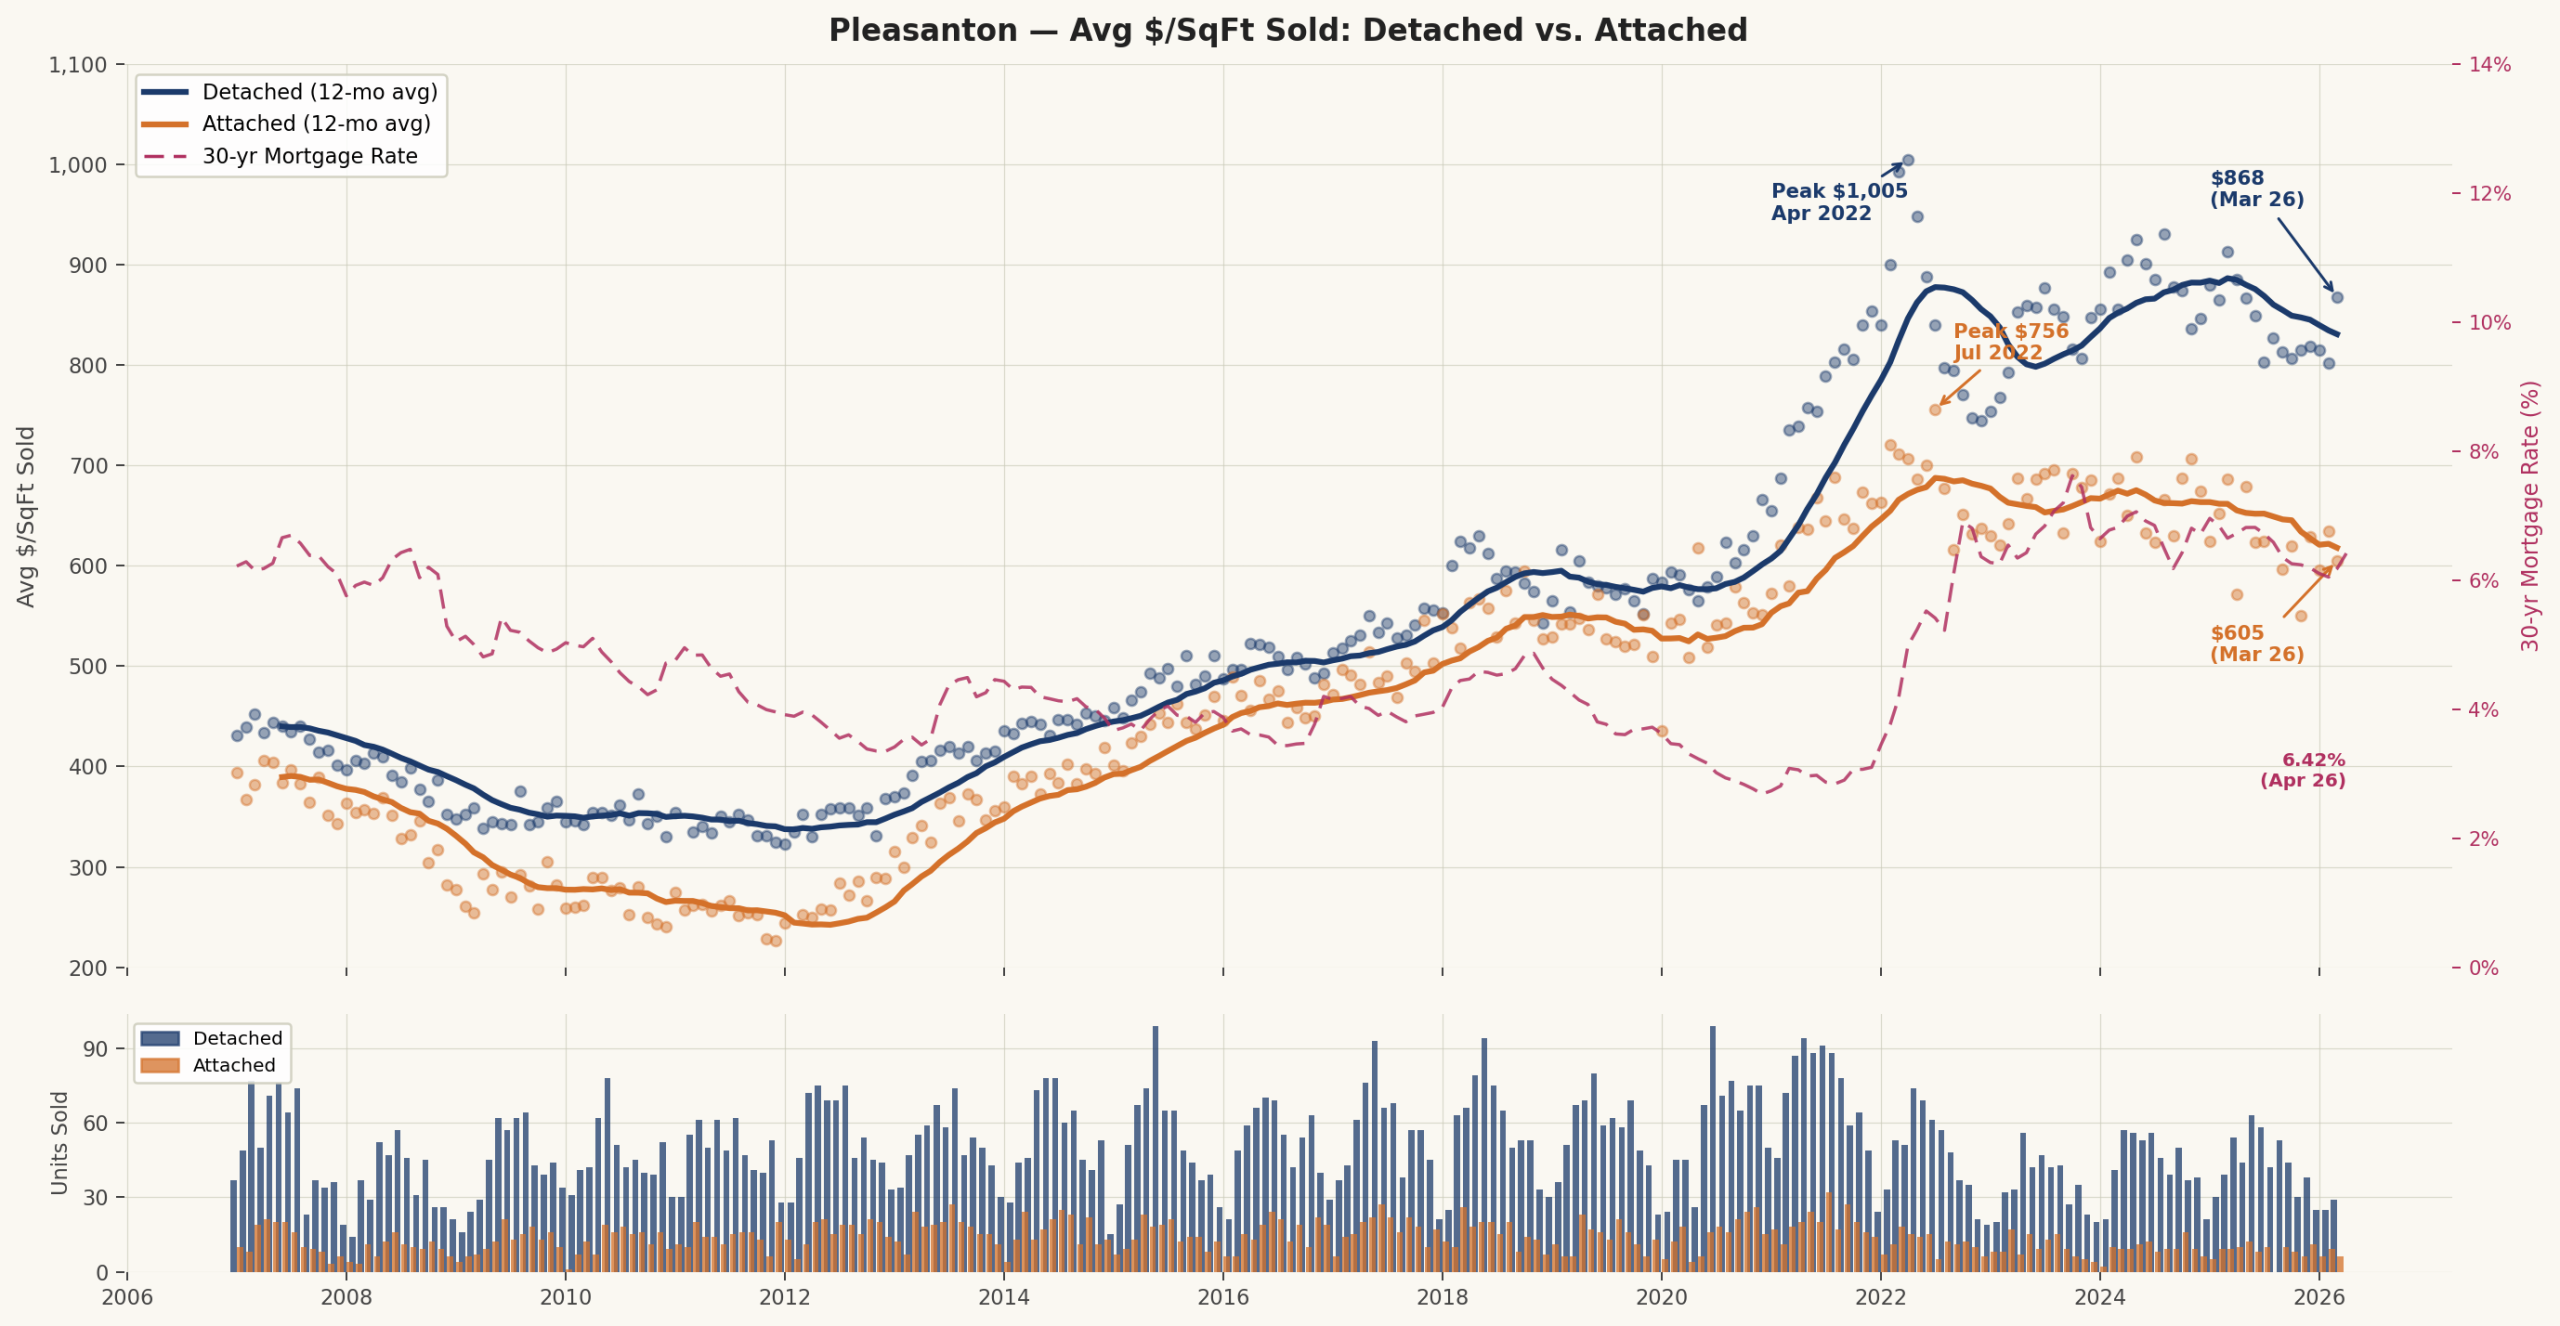
Bay East data for March 2026 shows detached homes averaging $868 per square foot — an $66 recovery from February’s $802 — while attached properties come in at $605. Inventory is rising from COVID-era lows, but 18 years of data make clear that “more listings” and “a buyer’s market” are not the same thing.
If you have been watching Pleasanton home prices this spring, you have probably noticed the market sending mixed signals. Detached homes bounced back sharply in March — Bay East’s aggregate hit $868 per square foot, up from $802 in February — yet that February reading was itself the softest the market had seen since early 2023. Mortgage rates remain in the mid-6% range. Active listings, while rising from their pandemic-era floor, are still nowhere near the levels that historically shifted negotiating leverage toward buyers. To make sense of any single month’s reading, you need the full 18-year picture.
As a buyer’s agent who works exclusively in the Tri-Valley, I track this data because it changes how I advise clients on timing, offer strategy, and realistic price expectations. Below I walk through five charts drawn from Bay East MLS aggregate data running from January 2008 through March 2026, covering price per square foot, year-over-year change patterns, months of supply, and active inventory — all for Pleasanton detached and attached homes separately.
The Long Arc: $/SqFt From the Financial Crisis to Today
Chapter One: The Crash Nobody Could Ignore (2008–2011)
Pleasanton detached homes entered the dataset averaging roughly $400–$440 per square foot in early 2008 — already well below the mid-2000s bubble peak. By the time the Bay East figures bottomed out in 2011–2012, the 12-month rolling average had slid to the low-$300s, a decline of approximately 25–30% from those late-cycle readings. Attached properties followed a similar trajectory and from a lower base. Transaction volume collapsed alongside prices — the volume bars at the bottom of Fig. 1 narrow visibly through 2008–2010, a reminder that distressed markets suppress sales counts as well as prices.
Chapter Two: The Long Green Run (2012–2019)
Recovery was gradual but persistent. From the 2011–2012 trough through roughly 2019, detached $/sqft climbed almost without interruption — from the low-$300s to approximately $550–$600. The slope was consistent enough that a linear trendline fit this stretch well, which is part of why the COVID surge looked so anomalous when it arrived. Mortgage rates during this period ranged from the high-3% to low-5% range, providing steady financing tailwinds. Attached properties tracked the same direction but at a lower absolute level and somewhat more volatility, reflecting the thinner monthly sales counts that make any single attached reading less reliable.
Chapter Three: The COVID Anomaly and Rate-Shock Correction (2020–2023)
The pandemic-era surge compressed roughly five years of appreciation into two. Pleasanton detached prices peaked at $1,003 per square foot in April 2022 — the only month in the 18-year dataset to breach four digits — driven by sub-3% mortgage rates, remote-work demand for larger homes, and constrained supply. When the Federal Reserve began its most aggressive tightening cycle in decades, the adjustment was swift: the 30-year fixed rate climbed from roughly 3% in early 2022 to above 7% by late 2023, and detached $/sqft retreated accordingly. The 12-month rolling average fell through 2023, and the YoY heatmap (discussed in the next section) turned visibly red for much of that year.
Chapter Four: Partial Recovery and a Volatile 2025–2026 (2024–Present)
The 2024 rebound brought detached prices back into the $850–$950 range on a rolling basis, and March 2026’s Bay East reading of $868 per square foot sits near the middle of that recovery band. That said, February’s $802 print — just one month prior — is a reminder that monthly readings are noisy, particularly when transaction counts are moderate. The 12-month rolling average, which smooths out month-to-month volatility, is the more reliable signal for trend direction. Attached homes have not recovered as strongly: at $605 (March 2026), they remain well below their mid-2022 peak and have struggled with weak demand and elevated supply relative to their own history, a dynamic I have analyzed in detail in the detached vs. attached gap analysis published earlier this month.
Reading the Year-Over-Year Signal: What the Heatmaps Reveal
A single month’s $/sqft reading is hard to interpret in isolation — it could reflect a genuine price shift or simply a different mix of homes that happened to close that month. The year-over-year change heatmaps below address this by comparing each month’s average $/sqft to the same month twelve months earlier, which removes seasonal patterns and controls for general market direction. Green cells indicate the market was pricier than the prior year; red cells indicate it was cheaper.


Several patterns stand out. The 2008–2010 columns are predominantly red — the financial-crisis correction showing up month by month. The 2012–2019 columns trend green with occasional interruptions, consistent with the steady recovery visible in Fig. 1. The 2020–2022 columns are among the deepest greens in the dataset: year-over-year gains during the COVID surge frequently exceeded 15–20% for detached homes. Then 2023 turns sharply red — the rate-shock correction registering in the YoY comparisons against those elevated 2022 readings.
The 2024 column shows a clear return to green for detached homes, but the comparison base matters: 2024’s positive YoY readings were partly mechanical, because they compared against the depressed 2023 figures. The 2025 detached column is more mixed, with some months showing modest positive YoY and others slipping back toward neutral or negative. The attached heatmap tells a more cautionary story in 2025: red cells appear more frequently and with greater intensity than in the detached panel, consistent with the attached market’s weaker supply-demand balance over that period.
For 2026, the heatmap data is partial and should be interpreted carefully — small sample sizes in any given month can move the YoY figure substantially. The trend to watch is whether detached YoY readings stabilize in positive territory as the spring selling season progresses, or whether they continue oscillating. Two months of data, as I have noted in prior analyses, is not enough to confirm a directional shift with confidence.
Inventory and Supply: “More Listings” Is Not “A Buyer’s Market”
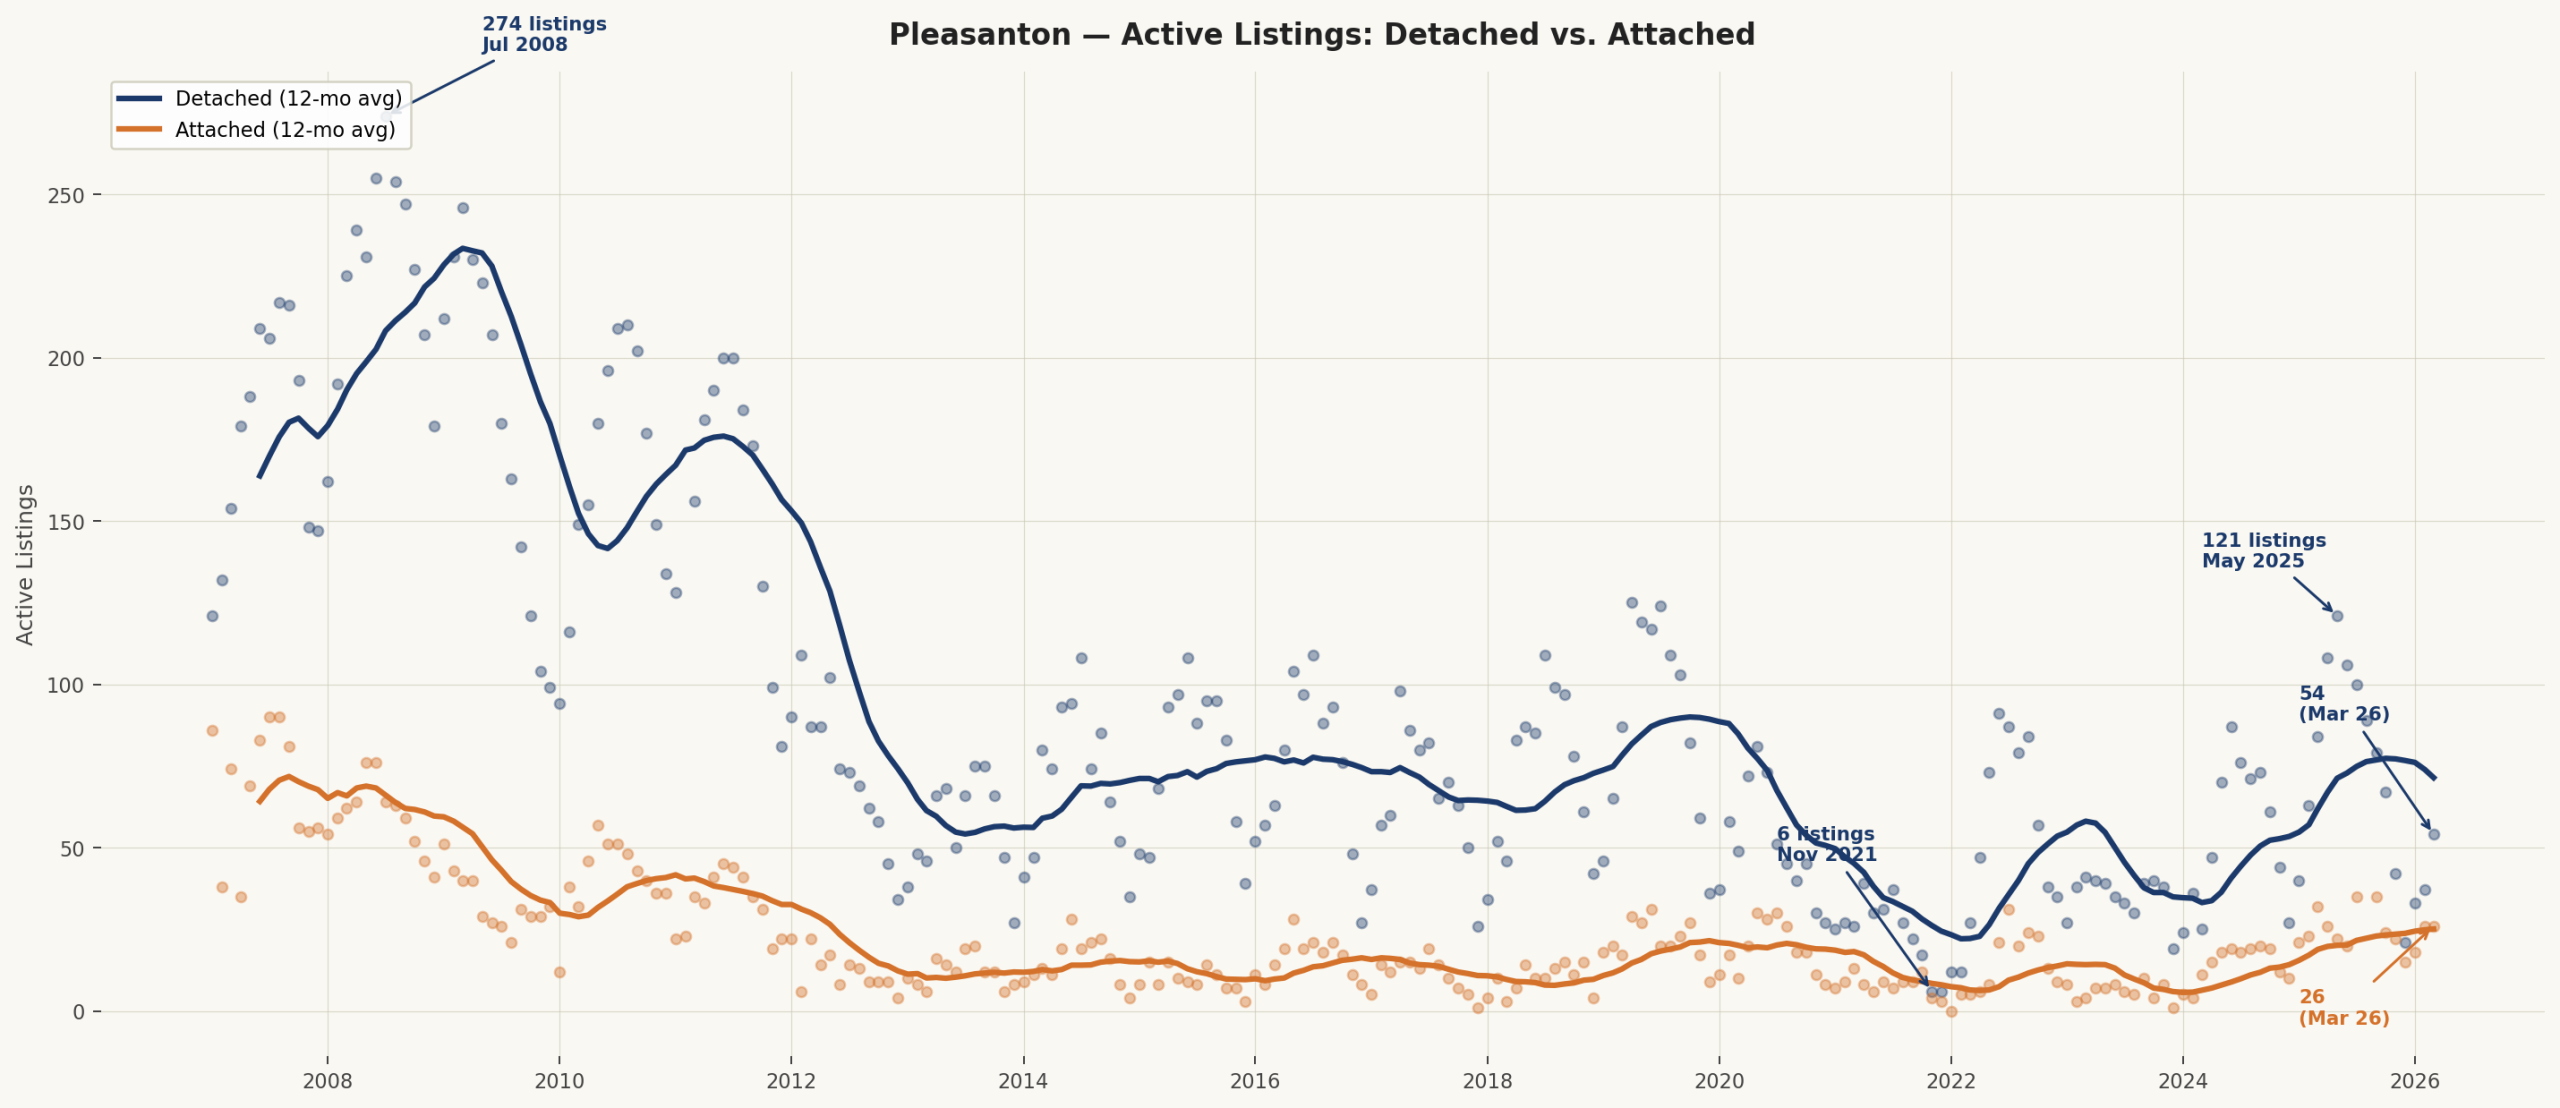
The active listings chart (Fig. 4) provides context that the $/sqft chart alone cannot: scale. Detached active listings peaked at 274 in July 2008, the high-water mark of the distressed market. By the COVID trough they had fallen to the 15–20 range. March 2026’s reading of 54 active detached listings looks like meaningful inventory recovery until you place it against that 2008 benchmark — it represents fewer than 20% of peak inventory. Attached listings at 26 are similarly low in absolute terms.
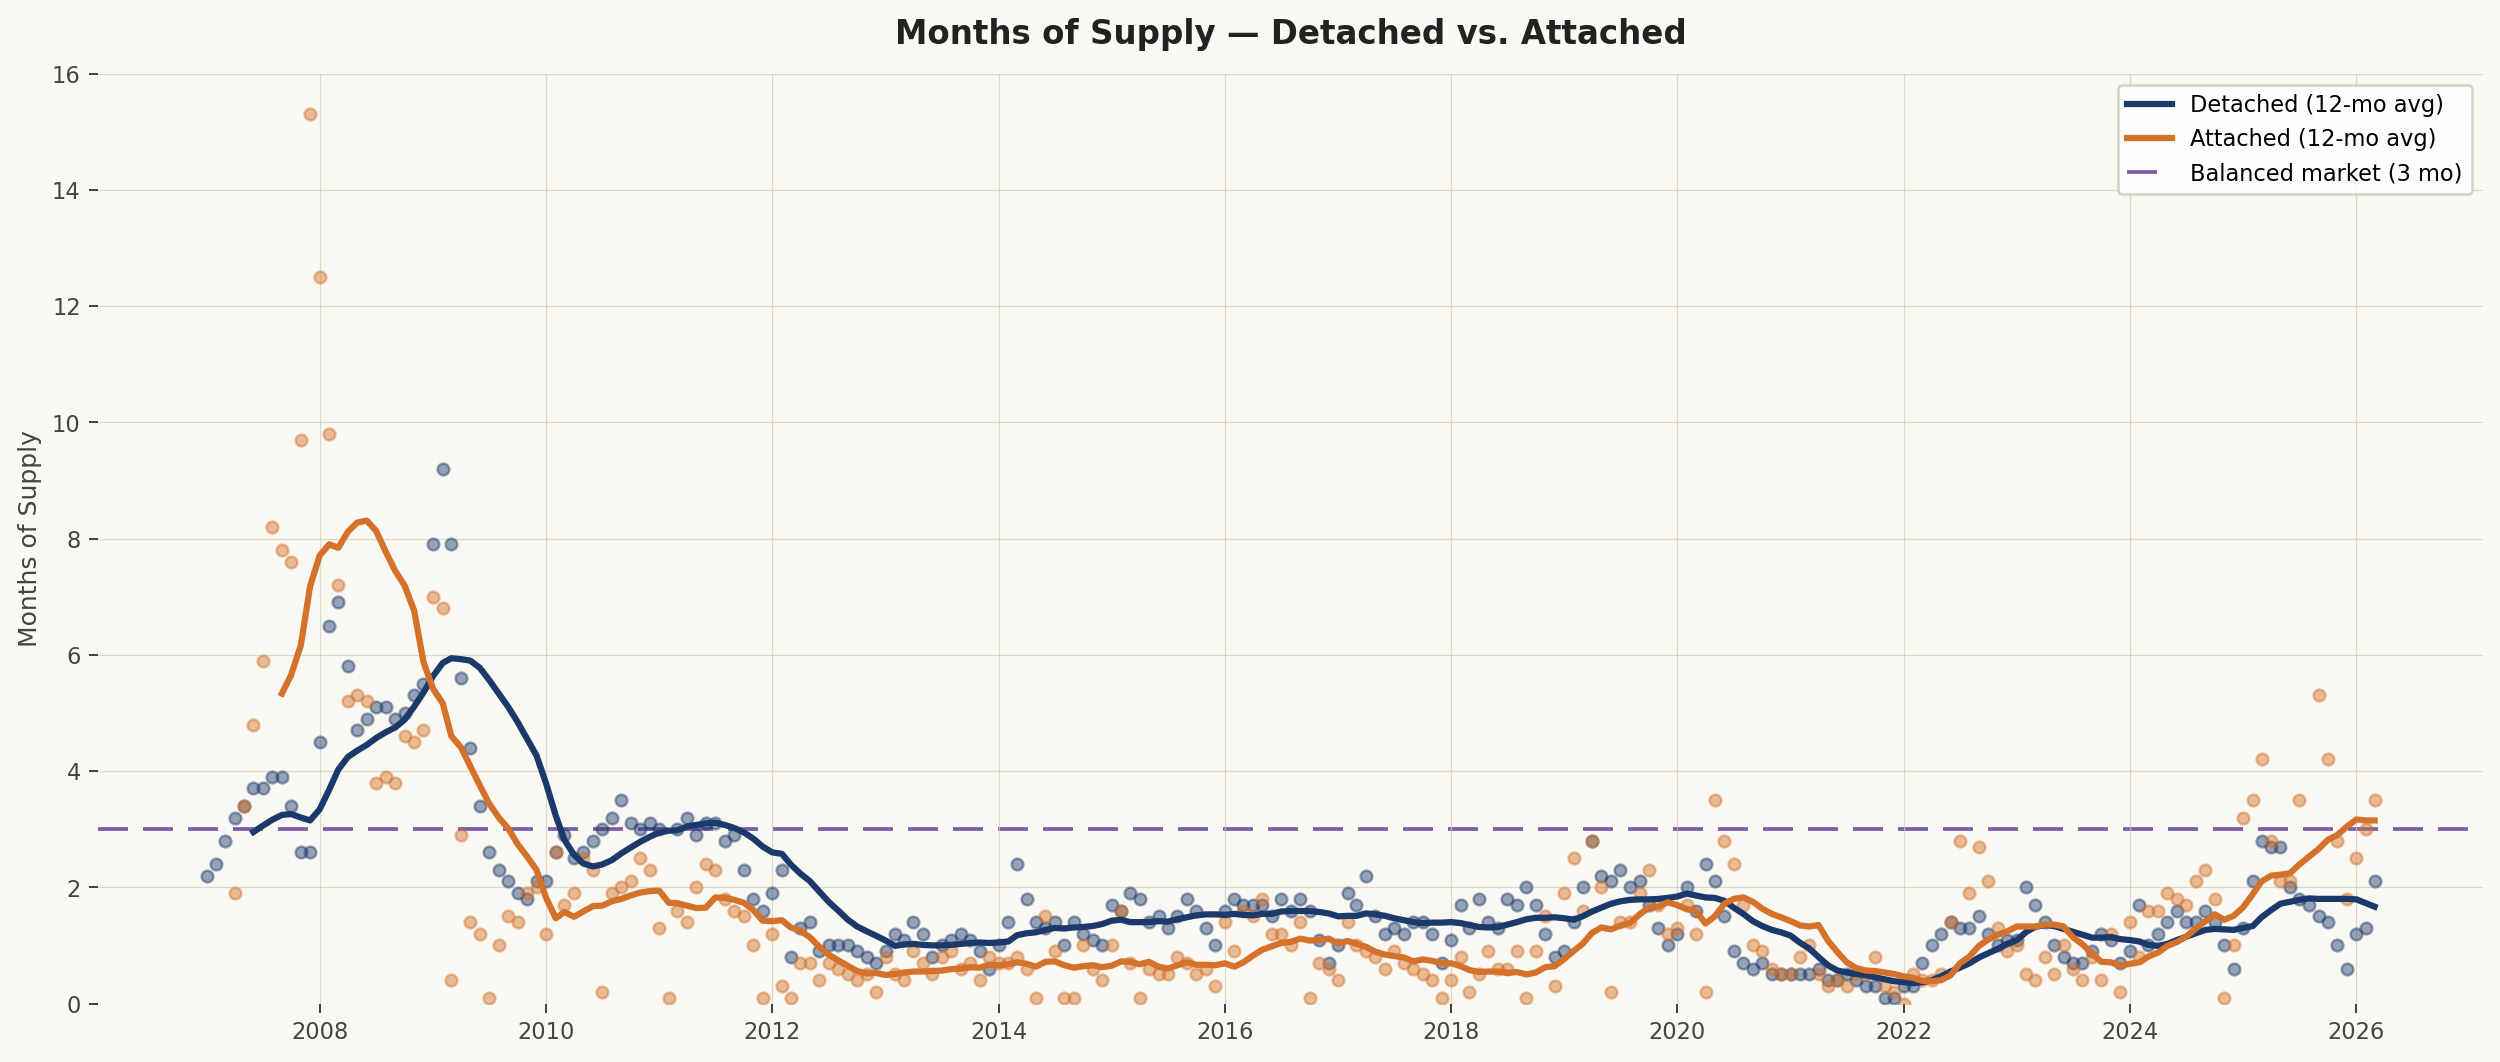
The months of supply chart (Fig. 5) expresses this more precisely by normalizing inventory against the pace of sales. Both detached and attached markets spent most of 2009–2010 well above the 3-month balanced-market threshold, with attached briefly reaching 15+ months during the foreclosure peak. Since approximately 2012, both series have spent most of their time below 3 months — and since 2020, largely below 2 months for detached homes. The attached market did push back toward and briefly past the 3-month line in late 2024 and into 2025 (peaking at 5.3 months in September 2025), which is why attached sellers faced meaningful headwinds during that stretch. As of March 2026, both series appear to be at or below 3 months, though the attached reading remains higher than the detached.
The practical implication for buyers: rising active listings relative to recent years does not mean negotiating leverage has shifted. Supply would need to climb substantially further — and stay there — before months-of-supply readings moved durably above 3 months for detached homes. The history in Fig. 5 suggests that has not happened in over a decade for that segment of the market.
What This Means if You Are Buying or Selling in Spring 2026
For buyers: The detached market’s February softness was real — $802 per square foot was the lowest Bay East monthly reading since early 2023 — but March’s rebound to $868 suggests it may have been a one-month fluctuation rather than a sustained trend break. Buyers who interpreted February as a durable price correction and positioned their search accordingly should be cautious about extrapolating that reading. The supply picture (54 active detached listings, months of supply near 1–2) does not yet support the kind of sustained buyer leverage that historically accompanied price declines. That said, mortgage rates at 6.42% continue to compress purchasing power relative to the 2020–2021 environment, and affordability constraints are real — I covered the income math in detail in the Pleasanton affordability trap post from earlier this year. The practical implication: buyers who are financially prepared and have a long time horizon are not waiting for conditions that the data suggests may not materialize; buyers who are stretching to qualify should stress-test their numbers carefully before committing.
For sellers of detached homes: March’s data shows the market absorbed the February dip and continued pricing at levels consistent with the 2024–2025 recovery range. The YoY heatmap for detached homes suggests the correction year (2023) is now firmly in the rearview mirror, though 2025’s mixed signals argue against complacency. Pricing strategy still matters: the 191-sale overpricing study from earlier this year showed that homes that sat 30+ days averaged an 8.1% discount to list, versus 1.5% for properly priced homes. Active listing counts are rising — from the COVID floor, not from a surplus — but sellers who misprice will find the market less forgiving than the spring 2022 peak suggested.
For attached sellers: The picture is more complicated. The attached YoY heatmap shows more red in 2025 than the detached panel, months of supply briefly exceeded 5 months last fall, and the $605 March 2026 reading remains well below the 2022 peak. The 2026 trend will depend in part on whether detached affordability constraints push more buyers toward attached as a price-accessible alternative — a dynamic worth watching as spring data accumulates.
Methodology Note
All $/sqft figures in this post use the Bay East Association of Realtors monthly aggregate data, which reports average sold price per square foot across all closed transactions in Pleasanton for each calendar month, separated by property type (detached single-family, and attached condominiums and townhomes). The 12-month rolling averages shown in Fig. 1 are computed as trailing 12-month means of the monthly data points; they reduce single-month noise but lag the most recent shifts by several months. Note that prior posts on this site have also cited figures derived from a direct MLS export filtered to specific criteria (property size, price range); those figures will differ from the Bay East aggregate used here due to differences in scope and methodology. The August 2025 attached data point is not reported in the Bay East source and has been excluded from the attached series. Year-over-year heatmap values for 2026 are preliminary and based on limited monthly observations; gray cells indicate months for which data is not yet available.
Work With a Buyer’s Agent Who Tracks the Data Monthly
Understanding a market like Pleasanton requires more than watching a headline number. It requires knowing which data source produced it, how it compares to the prior month and the prior year, what the inventory picture looks like, and how current mortgage rates interact with those figures to affect purchasing power. That is the analysis I do for every buyer I work with.
My practice is buyer-only and Tri-Valley-focused. If you are considering a purchase in Pleasanton, Dublin, or San Ramon, I am happy to walk through the current data and what it means for your specific situation — with no obligation and no sales pitch.
📩 Schedule a Free Buyer Consultation
- Bay East Association of Realtors — Monthly Market Activity Reports, Pleasanton (2008–March 2026)
- Freddie Mac Primary Mortgage Market Survey (PMMS) — 30-year fixed mortgage rate, April 2026
- DrXSong: Pleasanton Home Price — February 2026 Monthly Update
- DrXSong: Pleasanton Detached vs. Attached — 19-Year Gap Analysis (April 2026)
- DrXSong: The Pleasanton Affordability Trap (2026)
- DrXSong: Overpricing Case Study — 191 Closed Sales (March 2025–March 2026)
Leave a Reply