
After the COVID-era run-up, Dublin’s detached market has turned. Average price per square foot fell to $682 in May 2026 — down about 8% from a year earlier and roughly 22% below the May 2022 high. Supply has climbed past the balanced-market line, and the share of homes selling over asking has been cut nearly in half. Here is what 19 years of Bay East data and 601 recent closings show.
If you have been tracking the Dublin housing market in 2026, you have likely noticed the tone change. The bidding wars that defined 2021 and early 2025 have thinned. As a buyer’s agent who works exclusively in the Tri-Valley, I pulled two data sets to measure the shift precisely: the Bay East Association of REALTORS® monthly series back to January 2007, and every detached closing recorded in the Dublin MLS over the past two years — 601 sales in total.
The two sources agree. Dublin prices peaked, then cooled. The cooling is modest, not a collapse, and it has handed buyers a measure of leverage they did not have a year ago.
Nineteen years in one line
The chart below traces Dublin’s average price per square foot from 2011 through May 2026. The thin navy line is the monthly figure; the heavy red line is the 12-month rolling average, which smooths out the seasonal noise and shows the underlying trend.

The Long Recovery (2011–2019)
Dublin spent most of the 2010s in a steady, durable climb. Average price per square foot rose from roughly $273 in 2011 — the post-crisis floor — to about $500 by 2019. That is a gain of close to $31 per square foot each year, driven by the Tri-Valley’s job growth, top-rated Dublin Unified schools, and a persistent shortage of new supply. This was structural demand, not speculation.
The COVID Anomaly (2020–2022)
Then the pandemic reset the market. Remote work unlocked suburban demand, mortgage rates fell below 3%, and buyers bid aggressively. Dublin’s price per square foot surged from about $514 in 2020 to a single-month high of $878 in May 2022. Months of supply briefly fell below 0.3, and homes routinely cleared well above asking. These were conditions the data had never recorded before.
The Rate-Shock Correction and the 2024 rebound
The Federal Reserve’s rate hikes through 2022 and 2023 cooled the frenzy. Prices retreated, but they did not crash — the annual average held near $756 in 2023 and then rebounded to about $808 in 2024, the highest full-year reading on record. On a 12-month average basis, that 2024 figure marks the recent peak. What has happened since is the subject of this post.
Where the heat went: a year-over-year view
A single trend line can hide turning points. The heatmap below shows the year-over-year change in Dublin’s average price per square foot for every month since 2008. Green means a month sold higher than the same month a year earlier; red means it sold lower.
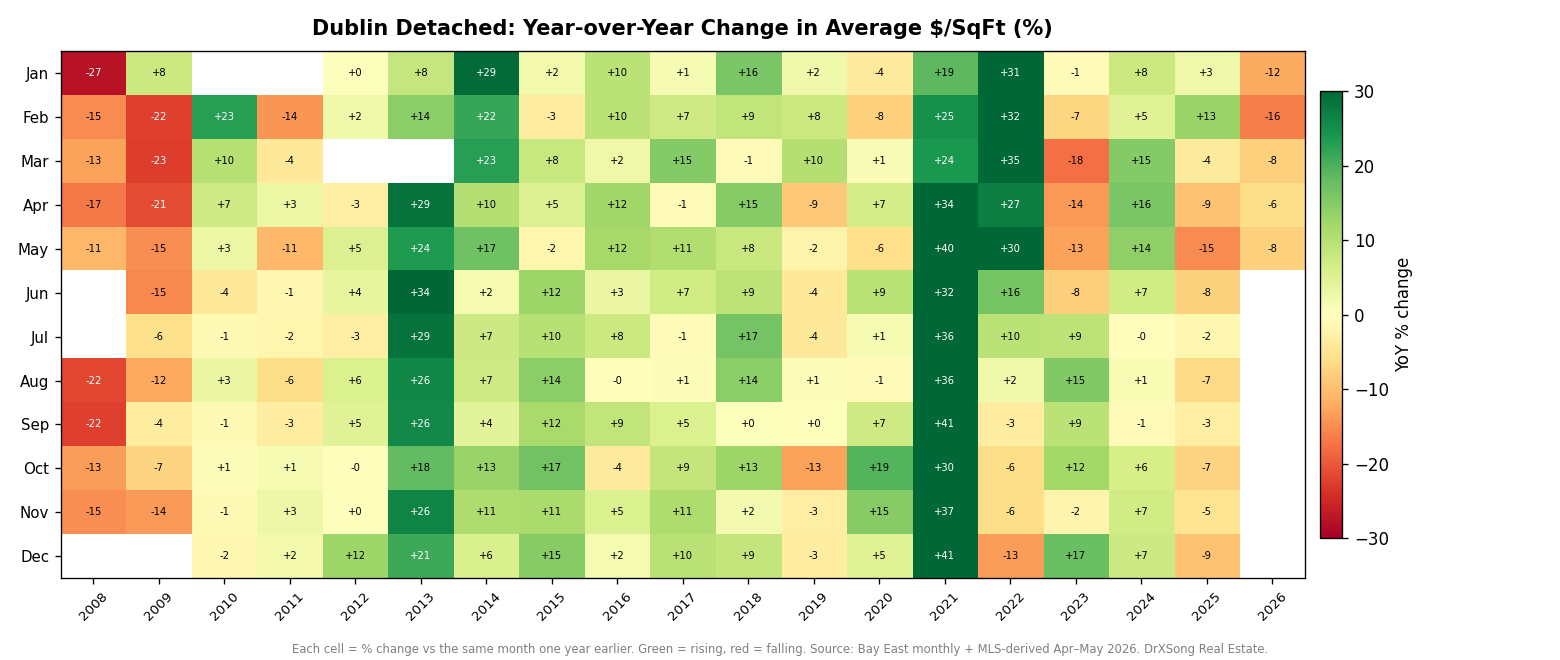
Three patterns stand out. The financial-crisis years of 2008 and 2009 run deep red. The 2021 and 2022 columns glow green, with several months running 30% to 40% above the prior year — the COVID surge. Most relevant for a buyer today: the 2025 and 2026 columns have turned red again. May 2026 came in 7.8% below May 2025, the clearest sign that the recent softening is a year-over-year trend, not a one-month blip.
Current conditions: supply up, urgency down
The cooling shows up in supply as much as price. Dublin held 68 active detached listings at the end of May 2026, which works out to about 2.6 months of inventory. That is above the 2.2 months recorded in February and above the roughly 3-month line that separates a seller’s market from a balanced one. For most of 2021 and 2022, Dublin ran below 0.5 months.
Homes still sell in reasonable time — the average was 24 days on market in May — but buyers are no longer paying a premium to win. On average, May closings settled at 99% of list price. A year of building supply has restored room to negotiate.
The clearest buyer signal: fewer homes over asking
The share of Dublin homes selling above their list price is one of the cleanest measures of who holds leverage. The chart below tracks it month by month across the recent closings.
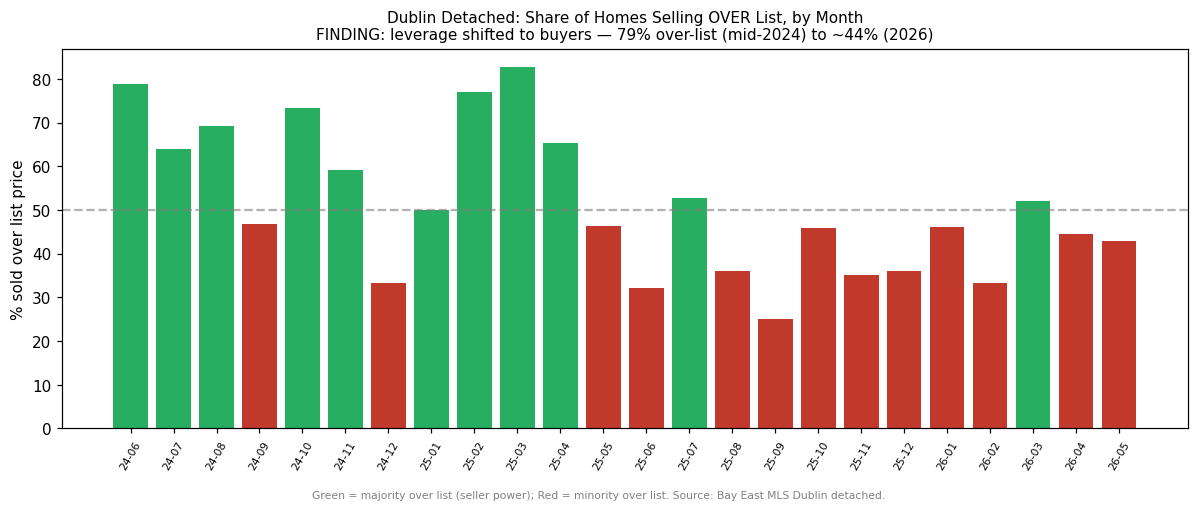
In mid-2024, close to 79% of Dublin homes sold over asking. By 2026, that share fell to roughly 44% — a minority of homes. Two related shifts confirm the change. Average sale-to-list slipped from about 104% in early 2024 to 99% by 2026. And seller concessions, which were almost unheard of in early 2024, appeared in roughly 37% of the recent closings that reported terms. Buyers are not just paying less per foot; they are also asking for, and receiving, more at the table.
What the average price hides: floor plan matters
A citywide price-per-square-foot figure blends very different homes. When I separate the 601 closings by floor plan, a consistent gap appears.
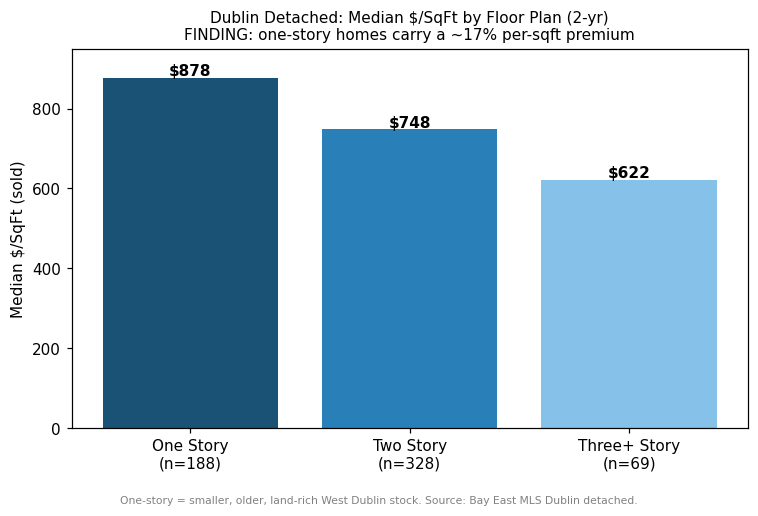
One-story homes sold at a median of $878 per square foot, against $748 for two-story homes — a premium of about 17% per foot. That looks backwards until you consider the stock. Dublin’s one-story inventory skews toward older, smaller, land-rich homes in the established west side, where buyers pay for the lot and the single-level layout. Two-story and three-story homes tend to be larger and newer, which lowers the price per foot even as the total price runs higher. The practical lesson: compare a Dublin home to others of the same floor plan, not to the citywide average.
What the data does — and does not — tell us about 2027
My earlier 19-year analysis of Dublin’s price trend and 2027 forecast projected a 2026 average between roughly $772 per square foot (linear model) and $888 (quadratic model). Dublin is tracking below that range so far in 2026, with readings in the $680s to $720s. In plain terms, the market is running cooler than the long-run trend line projected.
I will not put a single number on 2027. The honest answer is that the path depends on factors no local model controls — the direction of mortgage rates, Tri-Valley employment, and how much of today’s higher inventory persists into the spring. What the 19-year record does show is that Dublin has absorbed a financial crisis and a pandemic without a sustained decline below trend. The structural supports — schools, BART access, proximity to major employers — remain in place. A cooler market is not the same as a falling one.
Practical takeaways
For buyers: The leverage that vanished in 2021 has partly returned. With supply near 2.6 months, fewer than half of homes selling over asking, and concessions on roughly a third of closings, there is room to negotiate that did not exist a year ago. Two specifics worth acting on: write offers with realistic, not over-list, pricing, since the average home now settles at 99% of list; and judge price per square foot against homes of the same floor plan, because the one-story premium is real and persistent. For help sizing a purchase to your finances, see my Tri-Valley guide to how much house you can safely absorb.
For sellers: The 2021–2022 conditions are gone, and pricing discipline matters again. The 24-day average days-on-market hides a wide spread — correctly priced homes still move quickly, while ambitious list prices now sit and draw reductions. Presentation and a defensible list price do more for your result than they did two years ago.
Methodology note
Long-run figures come from Bay East Association of REALTORS® monthly market activity reports for detached single-family homes in Dublin, January 2007 through March 2026. April and May 2026 price-per-square-foot, days-on-market, and sale-to-list figures are computed from Dublin MLS closing records; where the two sources overlap (June 2024 through March 2026), they agree to within an average of about $2.50 per square foot, so the series is treated as continuous. Floor-plan, over-list, and concession figures are drawn from 601 detached closings in the Dublin MLS over the trailing two years. The COVID Anomaly window (2020–2022) is shaded on the long-run chart and excluded from trend description, consistent with my prior Dublin analysis. June 2026 is excluded as a partial month. All figures are reported as found in the source data and are deemed reliable but not guaranteed.
Work With a Buyer’s Agent Who Knows the Tri-Valley Data
Data is only useful when it is applied to your specific search. I bring the same quantitative rigor shown above to every client — mapping a property against comparable closings of the same floor plan, reading the active-listing trend into your offer date, and pricing your bid to the current sale-to-list reality rather than last year’s.
Ready to talk through your options in Dublin? A short conversation can map your search to the data and the specific neighborhood you are targeting.
📩 Schedule a Free Buyer Consultation
- Bay East Association of REALTORS® — Monthly market activity reports, Dublin detached single-family, 2007–2026.
- Dublin MLS — 601 detached closing records, June 2024–June 2026.
- Dublin, CA Housing Market: 19-Year Data Analysis & 2027 Price Forecast
- Tri-Valley Buyer Timing 2026: 19-Year Offer-Month Data
- Alameda County Housing Market 2026: 14 Cities, Two Tiers
- How Much House Is Too Much? A Tri-Valley Buyer’s Guide
Leave a Reply