
April 2026 attached homes (condos and townhomes) in Pleasanton printed $589 per square foot — the first positive April year-over-year reading since 2022, mirroring what the detached market just did. But the similarities end there. Two-thirds of attached closings sold below list, the drawdown from the COVID peak is twice as deep, and DOM is running 60% longer than detached. The two markets have decisively diverged.
If you read my April 2026 detached update, you saw the framing: pricing held, volume didn’t. The detached market’s per-square-foot average held at $897 (+1.4% year-over-year), with 8-day median DOM and 55% of closings selling above list. By the headline metrics, that market is defending its range.
Attached is not telling the same story. Same April-YoY-flips-positive inflection, yes — $589 vs $572 a year ago, +3.0%. But the absolute level is $589, against an all-time peak of $756 hit in July 2022. That is a 22% drawdown still on the table. Detached’s drawdown from peak is half that. And in April 2026, two-thirds of attached buyers got their property below list — the inverse of what happened on the detached side. This is a different market.
Below: the same four charts I ran for detached, this time on the 19-year Bay East attached series. Then the side-by-side comparison that puts the divergence in one place.
The $/SqFt Heatmap: Same April Inflection, Different Background
Each cell is the year-over-year percent change in average sold $/SqFt for that month compared to the same month one year earlier. April 2026 prints +3.0% — the first positive April reading on this heatmap since the +13.7% blow-off of April 2022.

Reading down the April row: the 2007–2011 era was unrelenting red — six straight Aprils of negative YoY through the financial crisis. The 2012–2019 long recovery produced a string of greens, including +12% to +17% in the 2013–2015 stretch as attached prices recovered off their $169 February 2012 trough. April 2022 was the COVID peak (+13.7% YoY on top of the prior year’s run). Then the rate-shock pulled attached down for three straight Aprils: 2023 (–2.8%), 2024 (–5.4%), 2025 (–12.0%). April 2026’s +3.0% breaks that streak.
What’s noticeable in the broader heatmap pattern is that attached prices have been more volatile than detached. Where the detached heatmap typically shows YoY changes of ±5–15%, attached frequently posts ±15–25% in single-month YoY swings. That volatility is partly a small-sample effect (a typical Pleasanton attached month has 6–15 closings, so individual property mix moves the average), but it also reflects a market that simply trades on thinner liquidity than detached.
The 19-Year Price Arc: A Steeper Climb, A Steeper Fall
The same data plotted as a time series shows the cycle clearly. Below: monthly average $/SqFt with a six-month rolling average overlaid, era-shaded.
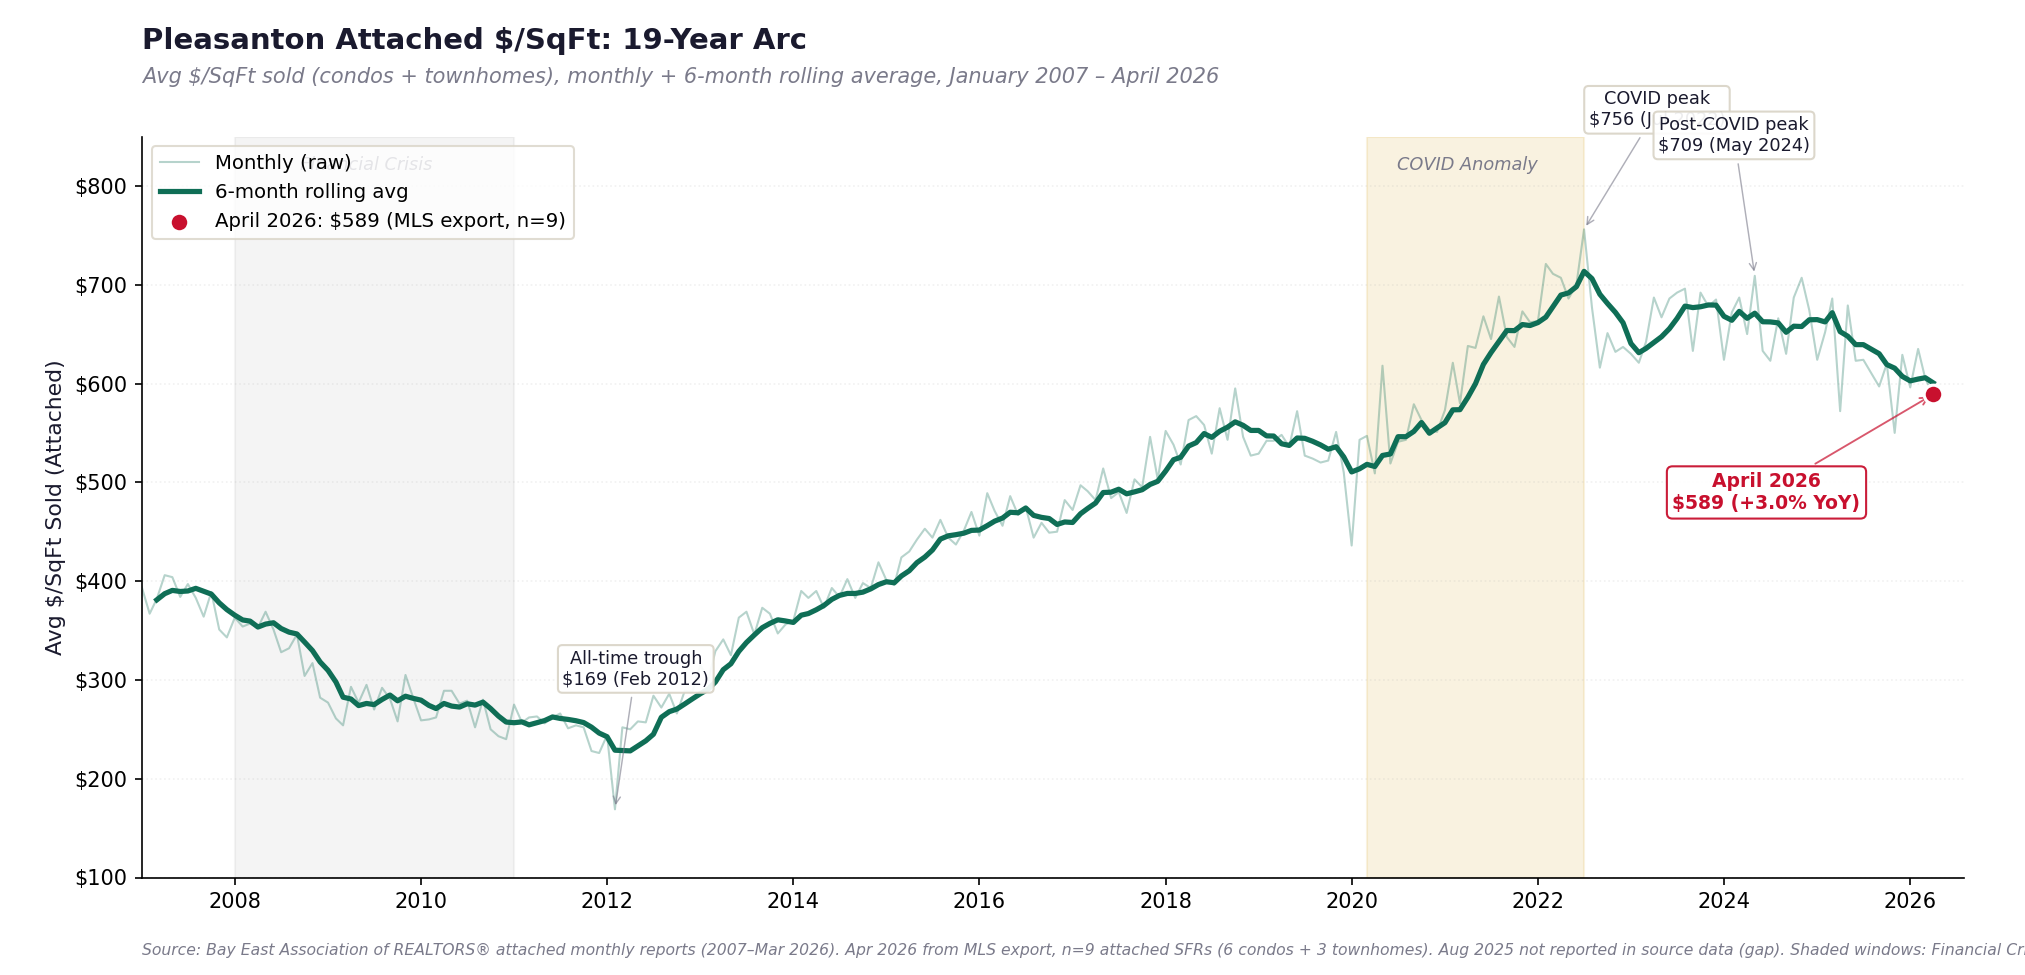
The attached arc is more dramatic than detached at both ends. The post-crisis trough was deeper — $169/sqft in February 2012, vs detached’s $237 in November 2011, a 29% bigger drawdown for attached. The COVID spike was sharper relative to baseline — attached jumped from roughly $480 in 2019 to $756 in July 2022, a 58% gain in three years; detached went from roughly $618 to $1,005 in the same window, a 63% gain. The recoveries are comparable in percentage terms; in absolute dollars, attached moves much less.
What’s interesting on the most recent stretch: attached’s smoothed line is in a visible downward drift since mid-2024. The 6-month rolling average peaked at $709 in May 2024 and has been declining gradually since — currently sitting in the low $600s. The April 2026 monthly point at $589 is below that smoothed line, not above it. This is structurally different from detached, where the smoothed line has been flat-to-slightly-up over the same period.
To frame the drawdown: April 2026 at $589 is 22.1% below the all-time peak ($756 in July 2022) and 16.9% below the post-COVID peak ($709 in May 2024). Detached, by contrast, is only 10.7% below its all-time peak and 1.8% below its most recent peak. The two markets are working off very different drawdown bases.
Volume: Attached Has Contracted More Than Detached
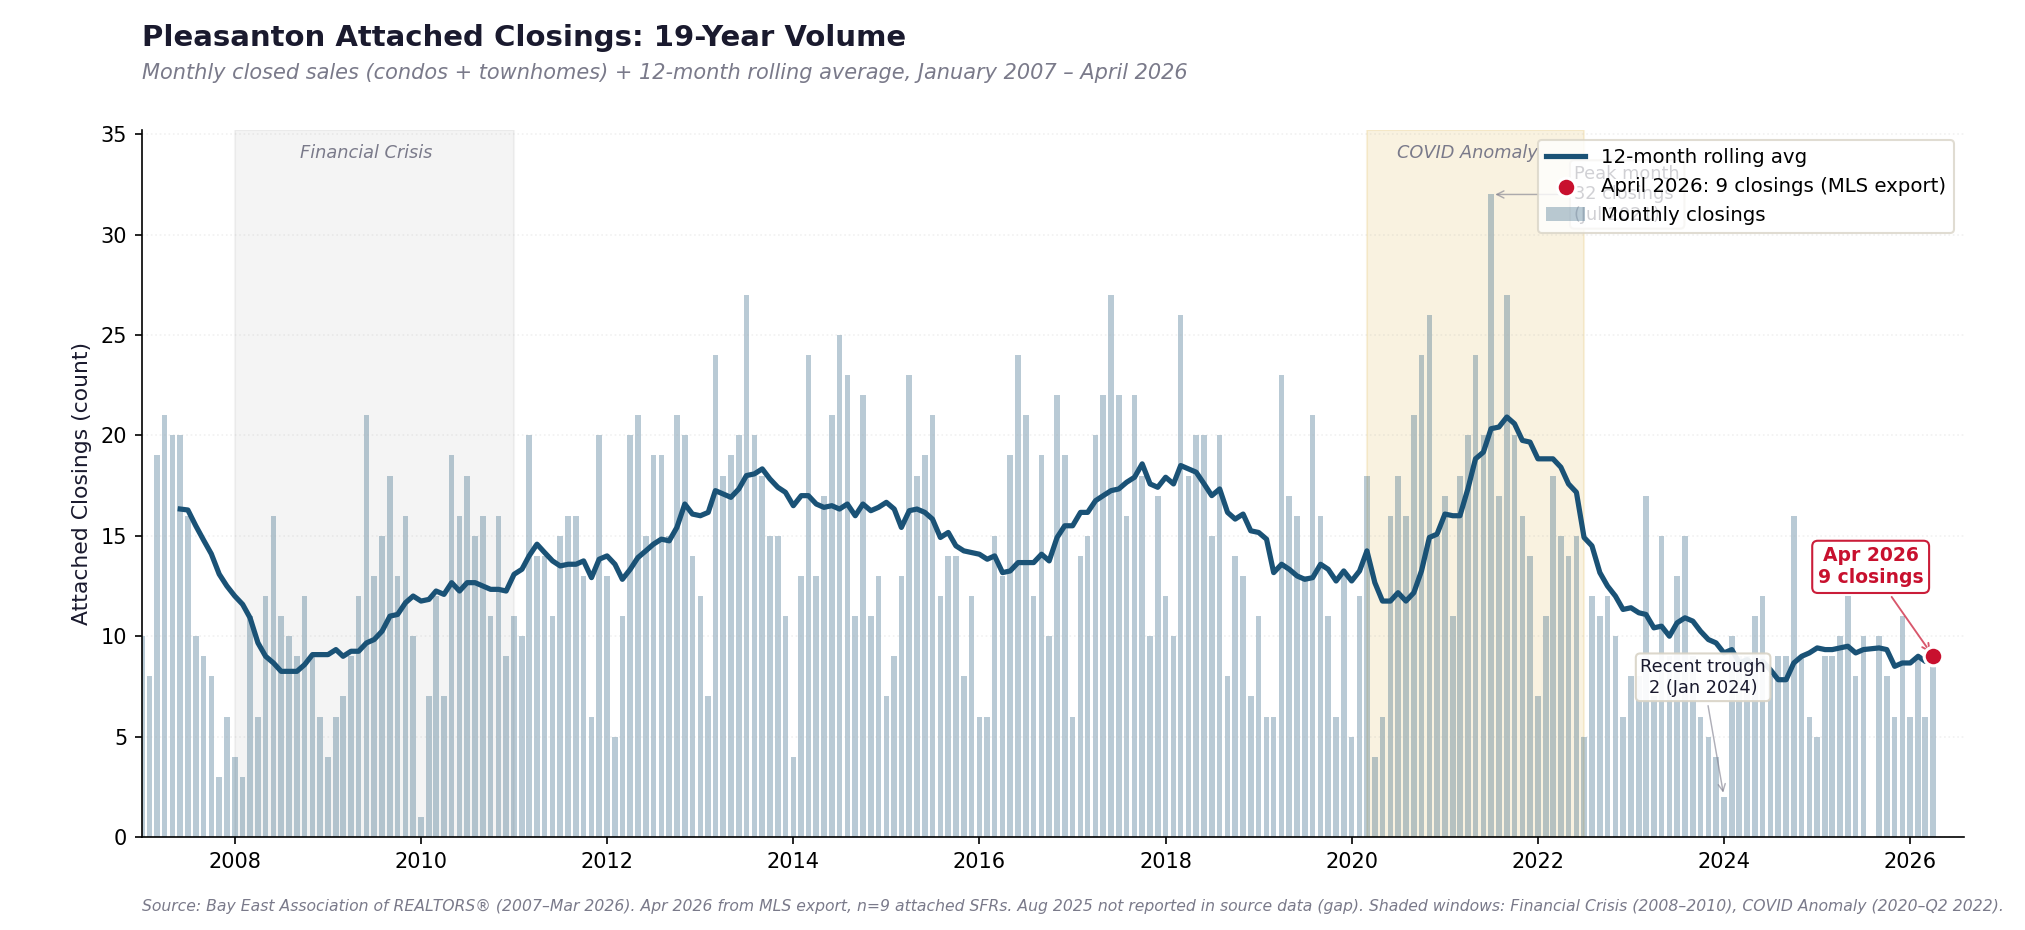
Attached volume in Pleasanton has always been thinner than detached — the city simply has fewer condos and townhomes than single-family homes — but the recent contraction is sharper in percentage terms. Annual attached closings: 236 in 2021 (the COVID volume peak), 98 in 2025. That is a 58% decline from peak to current run rate. Detached over the same window fell from roughly 720 (2018) to 515 (2025) — a 28% decline.
April 2026’s 9 closings are right inside the recent-year norm (April 2024 had 9, April 2025 had 10, April 2023 had 7). So this isn’t an anomalously slow month — it is the new baseline. The 12-month rolling average has been drifting in the 7–10 closings/month band since 2023, and the April reading sits cleanly inside it. The structural forces compressing detached volume (rate-lock, affordability, low inventory) compress attached volume too — and arguably more, because attached buyers tend to be entry-level and more rate-sensitive.
Days on Market: Slower Than Detached, Right Now and Historically
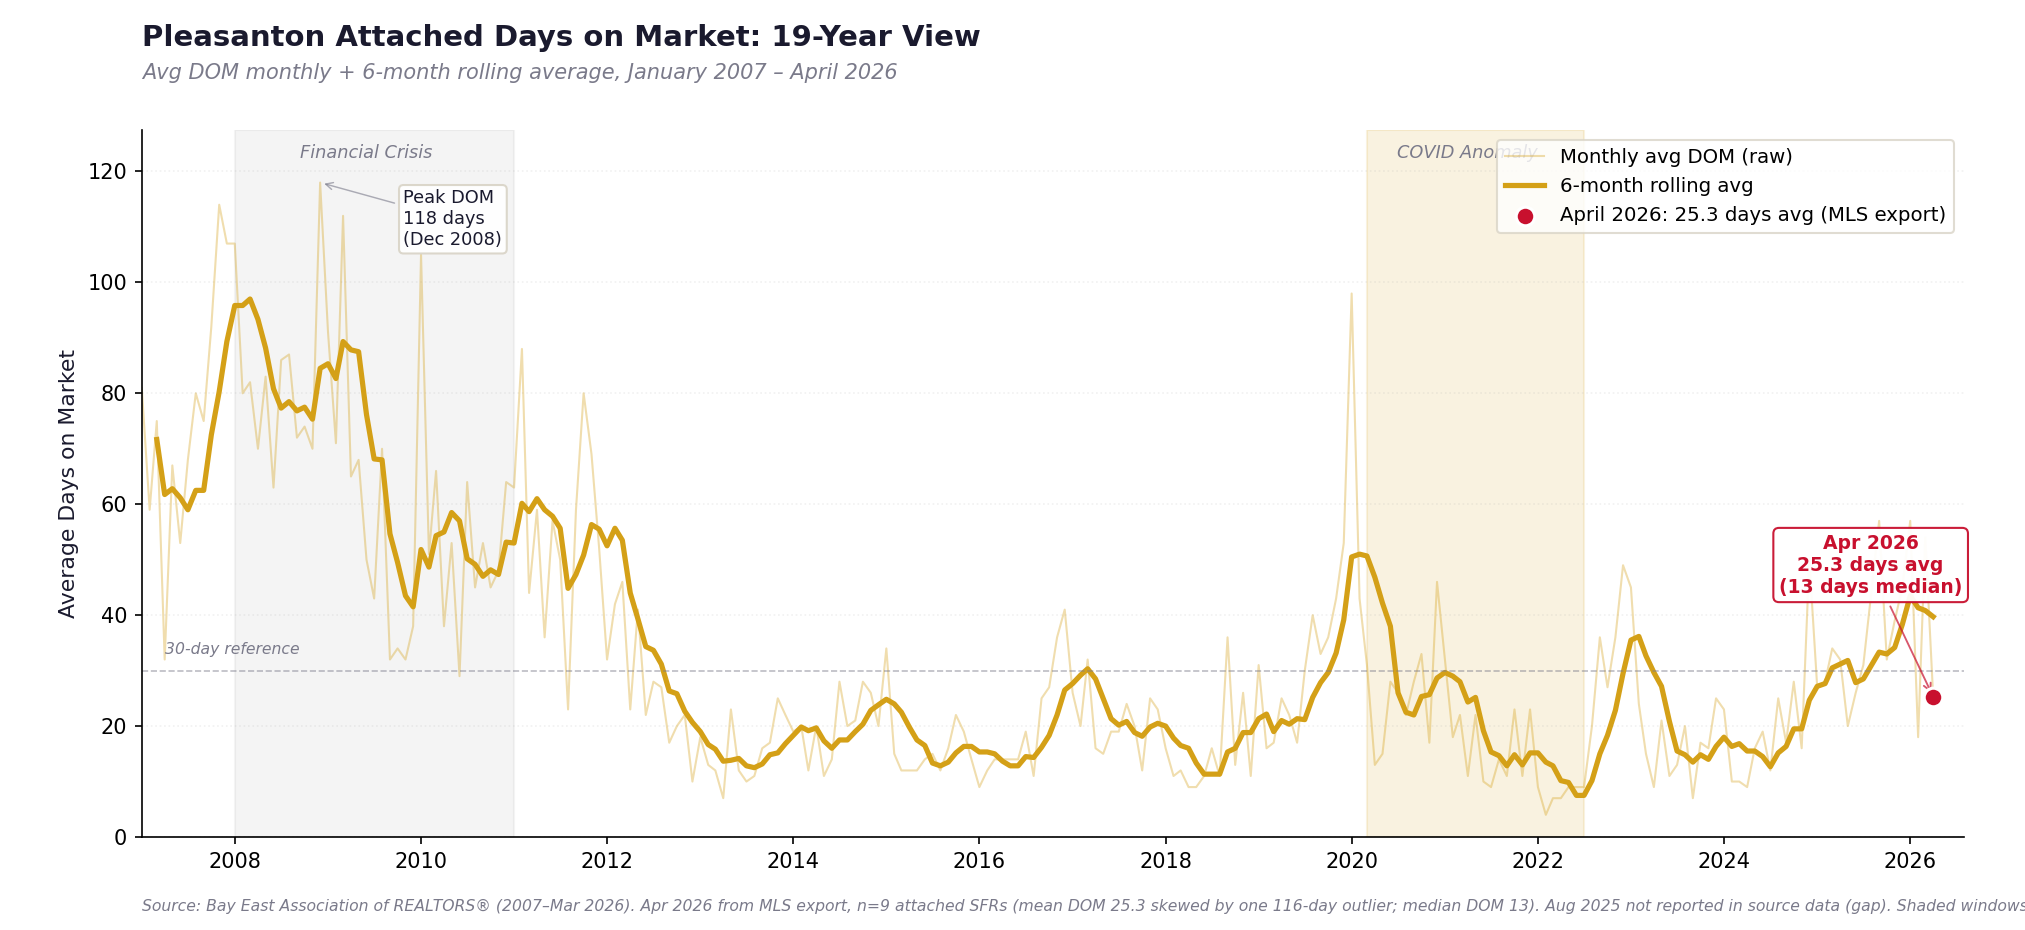
April 2026 averaged 25.3 days on market across the 9 closings, with a median of 13 days. The mean is being pulled up by a single 116-day outlier (an older 1972-build, 2BR/1BA condo on the southern edge of the city). The median (13 days) is the cleaner number and is consistent with the recent monthly cadence — Bay East’s January–March 2026 attached DOM averaged 18, 18, and 54 days respectively, also reflecting wide swings driven by individual long-tail listings.
The structural takeaway: attached DOM is consistently and meaningfully longer than detached DOM, even in the same market. Detached April 2026 median DOM was 8 days. Attached April 2026 median is 13 days — 60% longer. Across the 19-year series, attached has always run higher: even in the white-hot 2021–2022 window, attached averaged 11 days where detached cleared in 6–7. Attached buyers move more carefully because attached purchases involve HOA review, condo lender approvals, and financing scrutiny that detached transactions don’t face.
Detached vs Attached: The Numbers Side by Side
For readers who saw the April detached update, here is the head-to-head — same month, same city, same MLS export methodology, two different market segments:
| Metric (April 2026) | Detached | Attached (Condo / Townhome) |
|---|---|---|
| Closings (n) | 29 | 9 |
| Mean $/SqFt | $897 | $589 |
| YoY $/SqFt | +1.4% | +3.0% |
| Drawdown from all-time peak | –10.7% (vs $1,005 Apr 2022) | –22.1% (vs $756 Jul 2022) |
| Median sale price | $1,800,000 | $589,000 |
| Median DOM | 8 days | 13 days |
| Median sale-to-list | 101.1% | 99.0% |
| % sold OVER list | 55% | 22% |
| % sold UNDER list | 38% | 67% |
| Total monthly $ volume | $58.0M | $5.78M |
| Detached premium (per sqft) | +52.3% ($897 vs $589) | |
The detached premium per square foot — 52% in April — is at the high end of recent norms (the 19-year average is roughly 20%; the 2024–2026 average has been 35–36%). When attached prices fall faster than detached, the premium widens. When attached catches up, it compresses. The April 2026 widening is consistent with the deeper attached drawdown noted above.
What the Two Datasets Together Tell Us
The most useful interpretation is not “detached is strong, attached is weak.” Both segments showed positive year-over-year per-square-foot pricing in April 2026 for the first time since 2022. Both segments have monthly volume sitting at structural lows. Both segments are seeing concessions become a meaningful share of closings (~31% on detached, ~38% on attached among records where the field is reported).
The useful interpretation is that the two segments are working off very different drawdown depths. Detached, in absolute dollar terms, is sitting almost exactly where it was two Aprils ago — the round-trip for that segment is basically complete. Attached is still 22% below its all-time peak and has been drifting lower on the smoothed line for the better part of two years. April’s positive YoY is the first signal that the attached drift may be ending. One month is not a turn. But it is a break in a pattern.
For a buyer choosing between detached and attached in Pleasanton right now, the data argues for very different approaches. Attached buyers genuinely have leverage the detached market does not offer: 67% of April attached closings cleared below list, the median S/L was 99%, and concession structures (rate buydowns, closing-cost credits) are common. Detached buyers, by contrast, are competing for a shrinking supply pool where 55% of homes still sell above list — leverage there is at the margin, not the headline.
Practical Takeaways
For attached buyers (condos and townhomes): The data supports patience and disciplined offers. Two-thirds of April closings went under list. Median S/L was 99% even before factoring in seller concessions. Concessions appeared in 38% of closings where the field was reported. A starting offer at 97–98% of list with a request for $5–10K in closing-cost credits or a temporary rate buydown is defensible based on what just closed. Pay particular attention to HOA fees — the April closings range from $250 to $983/month, a 4x spread that materially affects total monthly carry. Two units at the same headline price can have very different effective costs once HOA is included.
For attached sellers: The market is more buyer-favorable than the detached market your single-family-home neighbor is selling into. Pricing matters more here than across the street. A look at the data: of the 9 April closings, the one that took 116 days to close cleared at 97.3% of list — eventually. The ones that closed in 8–13 days cleared at 99–105% of list. Speed of sale and final S/L are still tightly linked, just as they are in detached, but the entire distribution has shifted down. Price for the comparables, factor in your HOA’s recent assessments and reserve position (which buyers are scrutinizing more closely than they did three years ago), and be ready to negotiate concessions rather than headline price reductions.
For both: The attached and detached segments are in genuinely different modes right now. Treating them as one market — “Pleasanton real estate” — obscures more than it reveals. The buyer-side and seller-side strategies that work in one segment can backfire in the other.
Methodology
Historical $/SqFt, monthly closings, and average days on market for Pleasanton attached homes (condos and townhomes, 2007–March 2026) are sourced from Bay East Association of REALTORS® attached monthly market reports. April 2026 figures are derived from a Pleasanton MLS attached-sold export covering closings between April 1 and April 20, 2026 (n=9 closed transactions: 6 condos, 3 townhomes, all status “SLD,” no Sold Off Market records in this export). The April 2026 $/SqFt value plotted on the heatmap and trend chart is the simple mean of sale-price-per-square-foot across those 9 closings ($589); it is comparable in methodology to the Bay East “Avg $/SqFt Sold” figure but may differ when the official Bay East April 2026 attached report is published. The $/SqFt trend uses a 6-month rolling average; the closings count uses a 12-month rolling average; the days-on-market line uses a 6-month rolling average. The August 2025 cell on the heatmap is gray because Bay East did not report attached data for that month (per the source xlsx Notes). Cells from May 2026 forward are intentionally blank — data is not yet available. Year-over-year heatmap calculations use same-month comparisons and do not forward-fill missing values. The April 2026 mean DOM (25.3 days) is pulled upward by one 116-day outlier listing; the median DOM (13 days) is the cleaner descriptor of typical April activity.
Work With a Buyer’s Agent Who Reads Both Sides of the Market
If you are looking at condos or townhomes in Pleasanton, Dublin, or San Ramon, the April 2026 data argues for a more disciplined offer strategy than what works in the detached market across the same street. If you are weighing attached vs detached as your entry point into the Tri-Valley, the current divergence between the two segments is the central thing to understand.
Ready to talk through your options? A 30-minute conversation, no obligation, grounded in the actual numbers for your specific situation.
📩 Schedule a Free Buyer Consultation
- Bay East Association of REALTORS® — Pleasanton attached monthly market reports (2007–March 2026)
- Pleasanton MLS attached-sol
Leave a Reply