
March 2026 Bay East data for every Alameda County city Bay East tracks. Median sale, price per square foot, supply, days on market, drawdown from peak — and the one number that buyers tend to overlook: how much volume is still missing.
The question this post answers
Most “East Bay housing market” coverage stops at three or four headline cities. The county itself is rarely shown as one picture. As a buyer’s agent who works exclusively in the Tri-Valley, I get a version of the same question every week: How does what’s happening in Pleasanton compare to Berkeley, Hayward, or Castro Valley right now?
So I pulled the Bay East Association of REALTORS® monthly market reports for every Alameda County city the association tracks — 14 cities in all — and put March 2026 on one canvas. Where data goes back further (Jan 2007 for Pleasanton, Dublin, Livermore, Fremont, Hayward, Newark, Alameda; May 2014 for the others), I used the long history to anchor the snapshot in context.
Three patterns came out clearly. First, the county is split into two visible $/SqFt tiers, and every city in this analysis sits cleanly in one or the other. Second, the seller’s-market signal — sale-to-list above 100% and supply under three months — is broad-based: it shows up in 13 of 14 cities even with the 30-year fixed near 6.4%. Third, the volume recovery from the 2023 rate-shock trough is incomplete; in 13 of 14 cities, 2025 detached sales remain below the 2017 baseline.
Median sale, all 14 cities, on one canvas
The first chart sorts every Alameda County city Bay East tracks by March 2026 median detached sale price, with March 2025 plotted as a hollow marker so the year-over-year direction is visible at a glance.

A few things stand out. The county median across the 14 cities sits around $1.34M. Fremont leads at $1.75M; San Lorenzo anchors the low end at $795K — a 2.2× spread inside one county. Within the Tri-Valley the ordering is Dublin ($1.65M) → Pleasanton ($1.47M) → Livermore ($1.21M), which is the same ordering the prior Livermore newcomer guide documented for cross-city comparison.
The YoY directions are mixed. Berkeley’s median rose 10.5%, the only inner-band city positive on both median and $/SqFt year-over-year. Pleasanton’s median fell 21% — but the March 2026 Pleasanton update explains that this is largely a small-sample base effect against a March 2025 mix-shifted high; the Pleasanton $/SqFt YoY of −4.9% is the more stable read. The Mar 2025 Mar 2026 lines on this chart are useful as a sanity check, not as a forecast.
The two-tier $/SqFt structure
March 2026 average $/SqFt sold splits the 14 cities into two distinct bands. Above $900: Albany ($1,061), Berkeley ($968), Fremont ($1,106). Below $900: everyone else, ranging from Castro Valley ($640) up through Pleasanton ($868) and Union City ($833). The Tri-Valley three (Pleasanton $868, Dublin $734, Livermore $719) sit in the middle of the lower band — not at either extreme.
The structural reason for the gap is what each city contains. Berkeley, Albany, and Fremont have the closest combination of large employment anchors (Cal, the Berkeley Lab, the south-Bay biotech and tech corridor that pulls into Fremont via the BART extension) and the most constrained buildable land. Castro Valley, Hayward, and San Leandro are mid-county cities with longer commutes, larger lot inventories, and a different price tier of housing stock. The price line falls where the supply-and-demand fundamentals separate.
Supply tightness and bidding intensity are broad-based
The seller’s-market signal in March 2026 is not concentrated in one or two cities. Months of supply is under 3.0 in 13 of 14 cities, and the sale-to-list ratio is 100% or higher in every city. The chart below pairs the two on one canvas.

San Lorenzo (0.9 mo), Castro Valley (1.4), Berkeley (1.5), San Leandro (1.5), and Albany (1.6) are the tightest. The bidding-intensity line tells a complementary story: Albany 132%, Berkeley 129%, Oakland 121%, Alameda 114%. These are the cities where buyers are offering well above asking to clear a transaction.
Dublin is the one exception. At 3.8 months of supply, Dublin is the only Alameda County city in technically loose territory — and even there sale-to-list sits at 101%. This is consistent with Dublin’s relatively heavy newer-construction inventory and a higher share of attached/townhome product than the other Tri-Valley cities. For a buyer, Dublin currently offers more selection without giving up most of the seller’s-market price discipline.
Pleasanton (2.1 mo, 101% sale-to-list), Livermore (2.0 mo, 103%), Newark (2.5 mo, 103%), and Union City (2.7 mo, 106%) sit in the middle of both metrics. Hayward and San Leandro show short supply but more moderate sale-to-list, which historically correlates with shorter days-on-market in the entry-level price tier; the median DOM in Hayward is 28 days, the slowest in the county and a useful negotiation signal.
How far each city sits from its $/SqFt peak
Most Alameda County cities reached their detached $/SqFt peak in April or May 2022, just before the Federal Reserve’s 2022–2023 hiking cycle began to bite. A few peaked later — Fremont in April 2025, Newark in March 2024, Livermore in August 2024 — because demand in those cities held more steadily through the rate shock. The chart below shows the drawdown from each city’s all-time monthly peak to March 2026.

The pattern is inverse to price tier. The deepest drawdowns sit in mid-county: Alameda (the city) −26.0%, Castro Valley −24.8%, Union City −24.6%. The shallowest drawdowns are in the higher-$/SqFt cities: Fremont −4.2%, Hayward −10.2%, Berkeley −12.8%. Pleasanton at −13.6% is roughly mid-pack.
One way to read this: the cities with the highest absolute price levels also had the most resilient pricing power through the rate shock. The cities with cheaper entry-level housing stock saw more buyers exit — likely because the dollar-payment increase from a 3.5% rate to a 6.4% rate is a larger share of the entry-level buyer’s gross income than of the move-up buyer’s. The Tri-Valley barbell guide walks through the math on what a 200-basis-point rate shift does to a household’s debt-service ratio.
For buyers, the implication is the trade-off between drawdown depth and current competition. Castro Valley sits 25% off peak but has 1.4 months of supply and 103% sale-to-list — depressed pricing has not produced soft buying conditions. Fremont sits 4% off peak but has 1.8 months of supply and 106% sale-to-list — pricing power has held but buyers still bid above asking. There is no quadrant in this market right now where prices are deeply down and bidding is soft.
Volume tells a different story than price
Annual detached sales volume by city, indexed to 2017 = 100, makes the rate-shock damage visible. The 2021 COVID-low-rate volume spike is universal; the 2023 rate-shock trough is universal; the 2024–25 partial recovery is uneven.
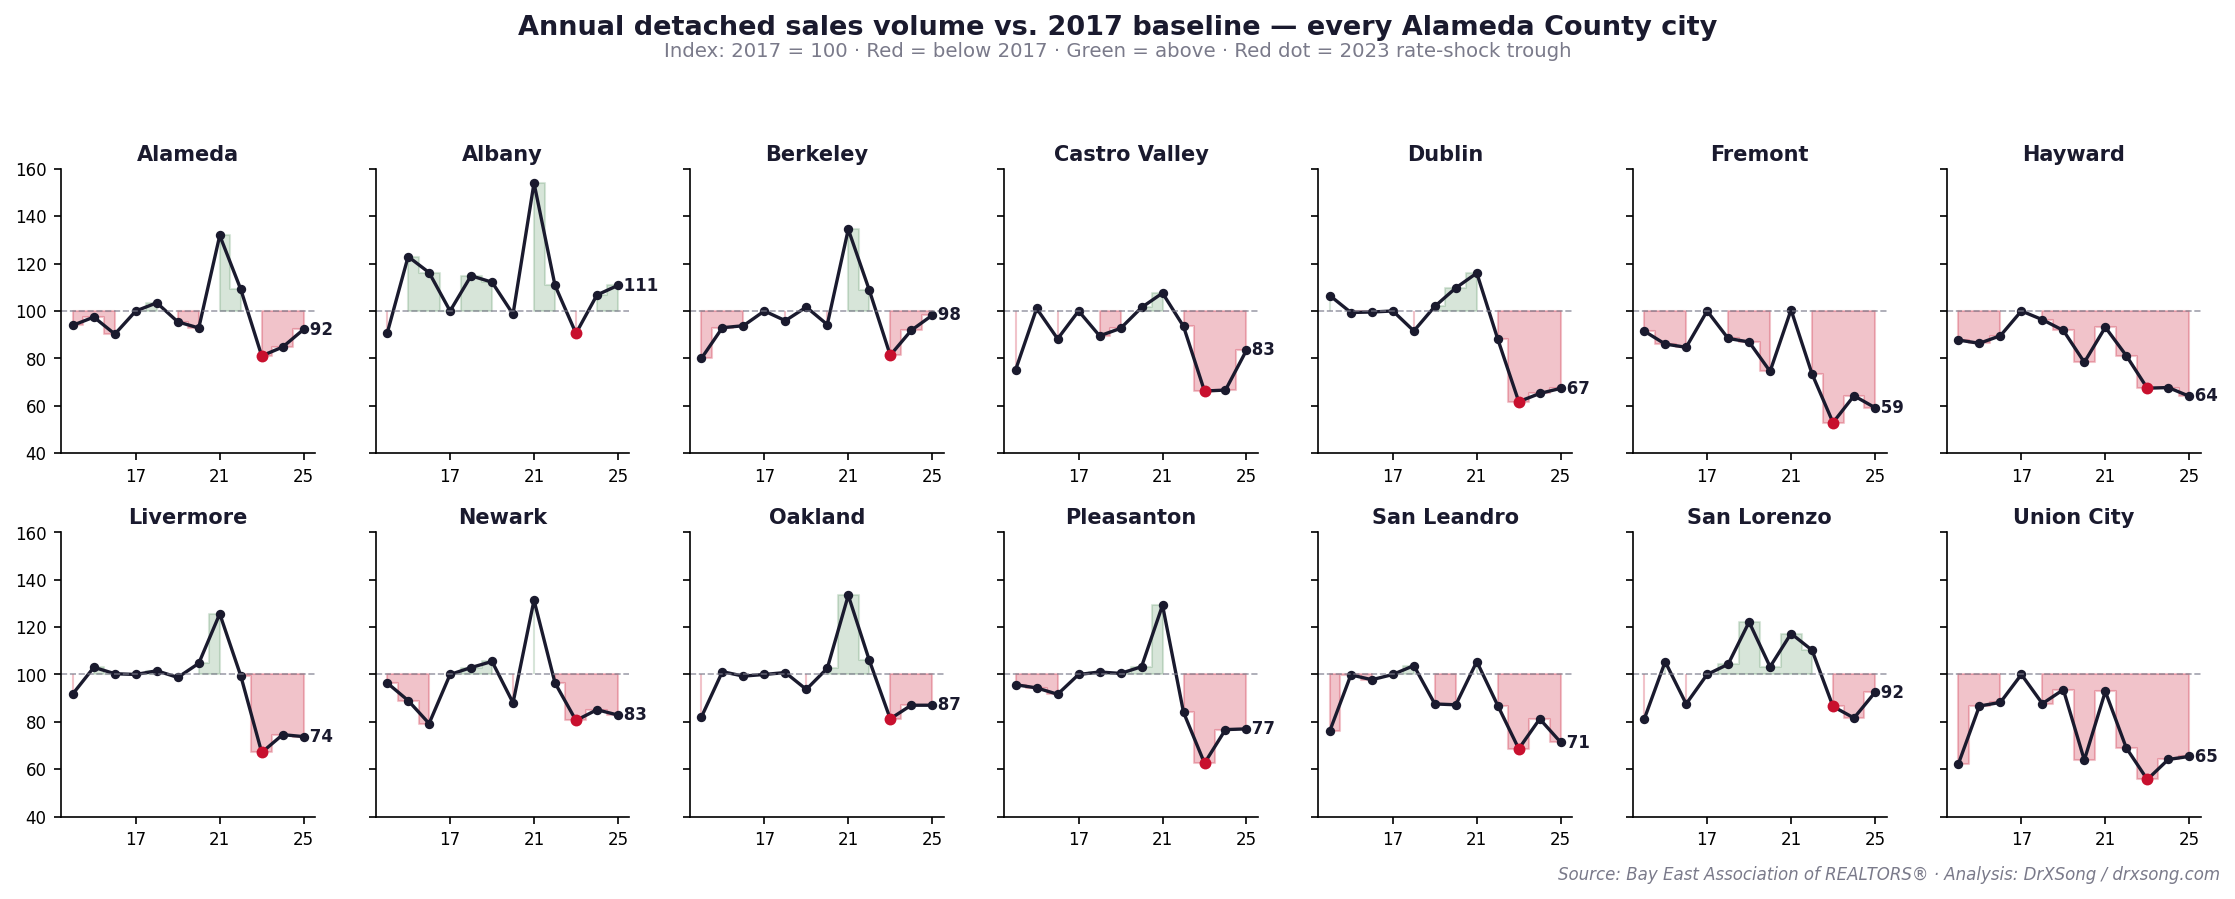
In 13 of 14 cities, 2025 detached sales remain below the 2017 baseline; only Albany finished 2025 above 2017 (82 vs. 74 closings). The largest deficits are in Fremont (−41% from 2017), Hayward (−36%), Union City (−35%), Dublin (−33%), San Leandro (−29%), and Livermore (−26%). Berkeley (−2%), Alameda (−8%), and San Lorenzo (−8%) are closest to back. Livermore at 705 closings in 2025 is still −41% below its 2021 peak of 1,201 and −26% below 2017 (956).
The driver is not buyer demand — sale-to-list above 100% in every city tells you demand is intact. The driver is rate-locked sellers. A homeowner who refinanced at 3.0% in 2021 and is now looking at a 6.4% replacement rate is not motivated to list unless something else changes their decision (job change, family change, retirement, divorce). The unsold housing inventory of 2025 is to a meaningful degree the same homes that would have changed hands at 2017 turnover rates if rates had not moved.
For buyers this matters in two ways. Selection is narrower than the listing site count would suggest, because turnover is suppressed. And competition for the homes that do reach market is broader — every active listing draws bids from buyers who would otherwise have had a wider menu.
Cross-county context — Alameda relative to neighboring counties
One framing question: is Alameda County’s market behavior unusual within the Bay Area, or is it broadly in line with the surrounding region? The Bay East dataset I used here covers Contra Costa cities as well, but I did not pull or analyze them for this post. The recent Tri-Valley agent performance analysis looked at Pleasanton, Dublin, and San Ramon in combination — San Ramon is in Contra Costa County, not Alameda — and showed similar sale-to-list and DOM patterns to what this post documents on the Alameda side. A future post can extend the same 14-city dot-plot framing across both counties.
What this dataset does not cover
Three honest gaps. First, Piedmont, Emeryville, and Sunol are not in Bay East coverage at the granularity used here, and the post does not include them. A buyer searching specifically for one of those cities should not extrapolate from the 14-city pattern. Second, the post is detached single-family only. Attached/condo data is reported by Bay East but with thinner monthly samples in most Alameda County cities; that is a separate analysis. Third, the unincorporated areas of Alameda County (Ashland, Cherryland, parts of Castro Valley) are reported partially in the Castro Valley row and partially nowhere; treat the 14-city panel as a city-level read, not a comprehensive geographic county read.
I do not have an Alameda County-level macro forecast in this post. A forecast would require integrating mortgage rate path assumptions, employment data, and longer-run regression work — that’s a separate post on the queue. What this post does is give the buyer a current, accurate snapshot they can navigate.
Practical takeaways by buyer profile
For the entry-level buyer (target ~$800K–$1.05M): San Lorenzo, Hayward, San Leandro, and the lower end of Oakland are where the median lives. Sale-to-list ratios are tighter (103–121%) and supply is short. Hayward’s 28-day DOM is the longest in the county and the most workable for a buyer who wants negotiating room — but watch the active inventory, which is still well below the 2008–2012 levels.
For the move-up buyer (target ~$1.2M–$1.55M): Pleasanton, Livermore, Castro Valley, Oakland (mid-tier), Alameda, and Newark all sit in this band. Castro Valley offers the deepest drawdown from peak (−25% $/SqFt); Pleasanton offers the strongest school anchor; Livermore offers the lowest median in the Tri-Valley three.
For the upper-tier buyer (target $1.55M+): Dublin, Berkeley, Fremont, Albany, and Union City are the dominant inventories. Dublin is the only loose-supply city in the county — 3.8 months of inventory at 101% sale-to-list — which is the closest the data comes to a buyer-friendly upper-tier market right now. Berkeley and Fremont are the inverse: tight supply, high $/SqFt, persistent above-asking bidding.
For every buyer: the volume gap matters more than the median number. Thirteen of 14 cities are running below 2017 turnover. The first listing in your target neighborhood will draw broader competition than a similar listing would have drawn in 2017. Be ready financially before the listing appears, not after.
Methodology Note
Data source: Bay East Association of REALTORS® monthly market activity reports for the 14 Alameda County cities present in Bay East coverage. Time frame: January 2007–March 2026 for cities with full coverage (Alameda, Dublin, Fremont, Hayward, Livermore, Newark, Pleasanton); May 2014–March 2026 for the remaining seven cities (Albany, Berkeley, Castro Valley, Oakland, San Leandro, San Lorenzo, Union City), reflecting Bay East’s reporting expansion. Detached single-family only; attached/condo not included. Two Oakland $/SqFt monthly prints (March 2020 and November 2023) were excluded as source-level outliers — both reported $3,000+/SqFt averages while the active-listing $/SqFt and adjacent months were under $700, indicating a Bay East reporting error or extreme single-month outlier sale; their exclusion is noted on Fig. 3. Charts use no smoothing of the March 2026 snapshot. The 2017 = 100 volume index uses each city’s own 2017 closings as the base. Source PDFs and the consolidated dataset (one sheet per city, 2,579 unique city-months) are stored in the project workspace.
Work With a Buyer’s Agent Who Knows the Tri-Valley Data
If you’ve made it this far, you’re the kind of buyer who wants the data behind the decision before the decision. That’s how I work too. I cover Pleasanton, Dublin, San Ramon, and Livermore directly, and I read the broader Alameda County market every month so the city you target is grounded in the wider picture, not isolated from it.
Ready to talk through your options? A short conversation is enough to figure out whether the market — and the cities you’re considering — fit the timeline and the budget you’re working with.
📩 Schedule a Free Buyer Consultation
This post is for informational purposes only and does not constitute financial, investment, or legal advice. Real estate markets are dynamic and past performance does not guarantee future results. Consult a licensed professional before making any real estate decisions.
- Bay East Association of REALTORS® — Monthly Market Activity Reports, January 2007–March 2026, all 14 Alameda County cities. bayeast.org
- DrXSong — Pleasanton March 2026 monthly update
- DrXSong — Moving to Livermore? A 19-Year Housing Data Guide
- DrXSong — Tri-Valley Buyer Guide: The Barbell Approach
- DrXSong — Tri-Valley Listing Agent Performance Analysis
- Freddie Mac — Primary Mortgage Market Survey (PMMS), 30-year fixed rate, April 2026.
Leave a Reply