
If you are relocating to the East Bay from another U.S. metro and deciding where to land in the Tri-Valley, Livermore sits roughly $240,000 to $340,000 below its neighbors’ March 2026 medians — but its market is no less competitive. Here is what 231 consecutive months of Bay East data say about prices, supply, and timing for a newcomer.
The Question a Newcomer Usually Asks
Most of my first conversations with out-of-state buyers begin with some version of the same question: “Is Livermore the cheaper option in the Tri-Valley, or is it a different market?” I work with buyers across all four Tri-Valley cities — Pleasanton, Dublin, San Ramon, and Livermore — and the honest answer is that it is both. Livermore is the most affordable of the four on a median-price basis. It also trades roughly in line with Dublin on a dollars-per-square-foot basis, competes on the same 15-day days-on-market clock as Pleasanton, and produces sale-to-list ratios of 103% right now. “Cheaper” and “easier” are two different claims, and only the first is supported by the data.
To ground this post, I pulled every monthly Bay East Association of REALTORS® market report for Livermore single-family detached homes from January 2007 through March 2026 — 231 consecutive months. The analysis below is built on that file. It is the same data a listing agent is using to price your next offer.
Nineteen Years on One Chart
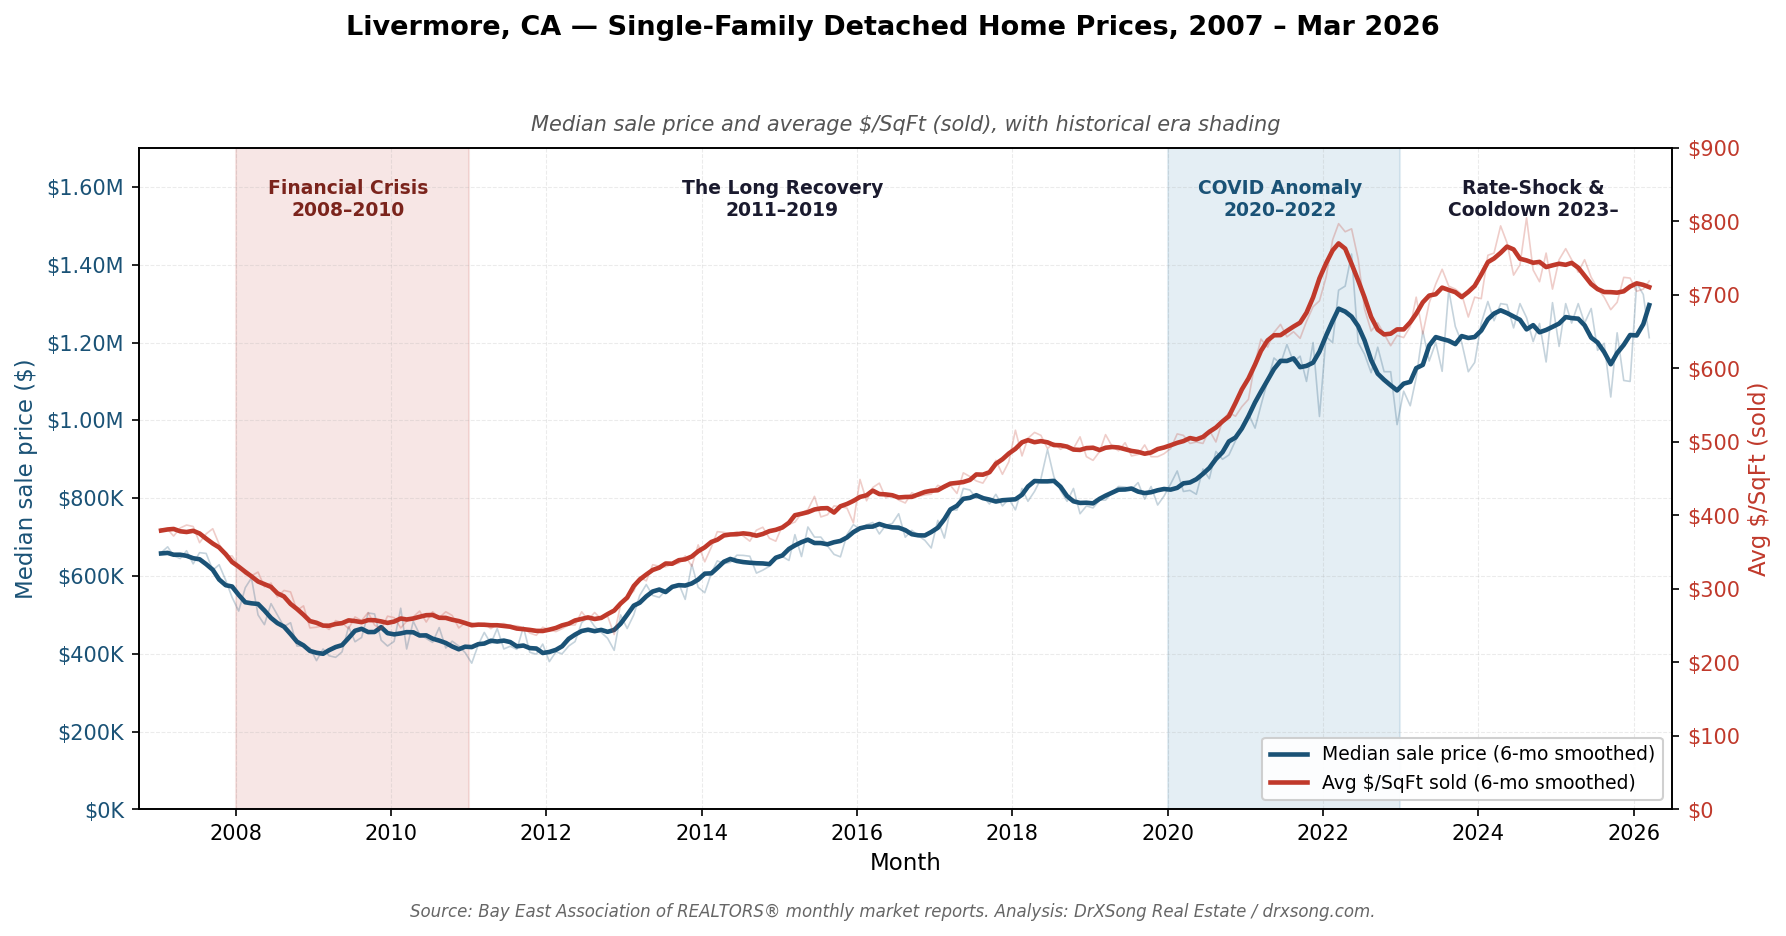
The blue line is the monthly median sale price. The red line is the average price per square foot paid by buyers who closed that month. I smoothed both with a six-month rolling average so the monthly noise does not obscure the long arc. The shaded bands mark the two periods a newcomer should know about: the Financial Crisis and the COVID Anomaly.
The Pre-Crisis Peak (2007)
Livermore entered 2007 with a January median of $660,000 and an average $/SqFt of $382. Inventory was elevated — 370 active listings on average through the year and 5.3 months of supply — the early signal that the housing cycle had already turned. By the end of 2008 the annual median had fallen to $490,329. If you lived through this in another metro, the shape of the Livermore crash will feel familiar.
The Financial Crisis (2008–2010)
The crisis took Livermore’s $/SqFt from $382 (January 2007) to $237 at the November 2011 trough — a 38% decline in the price paid per square foot. The annual median bottomed at $423,873 in 2011 before recovery began. This is the lowest per-foot price Livermore has recorded in the full 19-year series.
The Long Recovery (2011–2019)
From late 2011 through the end of 2019, the market climbed steadily. By December 2019 the median had reached $805,500 and $/SqFt $484. Months of supply compressed to 0.7 — a reading that would normally read as “extreme scarcity” except that, in hindsight, it was the new baseline. Volume was stable at roughly 944–985 closings per year through this window. For a newcomer, this is the era that best approximates a “normal” Livermore market: rising prices, tight but not frantic supply, and days on market in the 20–30 range.
The COVID Anomaly (2020–2022)
COVID produced Livermore’s all-time peak median: $1,427,500 in May 2022, with 112 closings that month and just 9 days of market time. Annual volume hit 1,201 closings in 2021 — the highest in the 19-year series. This is the period I exclude from long-run trend regressions, because the rate environment and remote-work migration combined in ways that have no precedent in the local data.
Rate-Shock and Cooldown (2023–present)
Rising mortgage rates cut 2023 volume to 641 closings — the lowest annual total since 2008. Prices drifted rather than crashed: the 2023 annual median was $1,165,029, only 3.2% below 2022’s $1,203,458. The 2024 $/SqFt rebounded to an all-time peak of $805 in August. The 2025 year closed at a $1,203,583 median on 705 closings, and the first quarter of 2026 has settled into a slightly softer tone — the YoY comparison above shows median down 3.0% and $/SqFt down 3.9% at the March 2026 reading.
How Livermore Compares to the Other Three Tri-Valley Cities
For a buyer choosing between cities, the most useful reference is a side-by-side of the most recent month available for each. All values are sourced from the Bay East monthly files for single-family detached homes.
| City | Data Month | Median Sale | $/SqFt | Months Supply | Avg DOM | Sale / List |
|---|---|---|---|---|---|---|
| Pleasanton | Mar 2026 | $1,470,000 | $868 | 2.1 | 15 | 101% |
| Dublin | Feb 2026 | $1,555,000 | $720 | 2.2 | 29 | 99% |
| San Ramon | Feb 2026 | $1,450,000 | $769 | 2.1 | 16 | 102% |
| Livermore | Mar 2026 | $1,212,500 | $719 | 2.0 | 15 | 103% |
Read the table in two directions. Down the median-price column, Livermore is the low-cost entry point — $238,000 to $343,000 below the other three cities. Down the $/SqFt column, Livermore is not the cheapest-per-foot market: it is effectively tied with Dublin ($720 vs $719), sits below San Ramon ($769) by about 7%, and is 17% below Pleasanton ($868). In other words, Livermore delivers more square feet of house for fewer total dollars, not a lower price per square foot than every neighbor. The underlying housing stock in Livermore tends to be larger on average, which is what produces the lower median even as the per-foot cost overlaps with Dublin.
Across supply, DOM, and sale-to-list, the four cities read very similarly. All four sit at 2.0–2.2 months of supply, below the 3.0-month threshold I use for a balanced market. Livermore, San Ramon, and Pleasanton all show 15–16 days on market; Dublin is the outlier at 29 days. Sale-to-list spreads are tight at 99–103%. A newcomer who assumes Livermore will be “easier” because the headline price is lower should look again at the DOM and sale-to-list columns.
When to Shop: A Seasonality Pattern Worth Planning Around
For a buyer who can pick their window, Livermore has a pronounced seasonality. Using monthly averages from 2015–2019 and 2023–2024 (excluding the COVID window), the following pattern emerges:
- Inventory peaks in July at roughly 106 active listings on average — the year’s widest selection.
- Competition peaks April through June: average days on market compresses to 15–17 days, and sold volume averages 82–96 closings per month.
- Inventory is thinnest in December at around 35 active listings, but sold volume in December still averages 63 closings — buyers who are ready in winter face fewer choices but less competition (DOM averages 28–30 days in November and December).
- Median sale price is roughly 7% higher in June than January on the seasonality average, but this is a mix-shift effect — smaller and entry-level homes make up a larger share of winter closings — not a pricing rule.
If your move-in timing is flexible, the softest negotiating window tends to be November through January. If your timing is driven by a job start or a school-year calendar, expect April through June to be the fastest and most competitive months of the year, and plan your financing, reserves, and inspection strategy accordingly.
What Livermore Is, Beyond the Price Chart
A newcomer choosing a city is not making a decision about price alone. Below is a short factual sketch of Livermore, with each item anchored to a primary source so you can verify the specifics for yourself rather than rely on my paraphrase.
- Science corridor. Livermore is home to Lawrence Livermore National Laboratory and to Sandia National Laboratories’ California site, both operated for the U.S. Department of Energy. (LLNL — About; Sandia — Livermore, California.)
- Livermore Valley wine region. Livermore Valley is a federally recognized American Viticultural Area and one of California’s older wine-growing regions. (TTB — Established AVAs; Livermore Valley Wine Country.)
- Public transit. The closest BART station is the Dublin/Pleasanton terminus of the Blue Line, west of downtown Livermore. The Altamont Corridor Express (ACE) commuter rail serves downtown Livermore directly and connects to the San Jose area. (BART stations; ACE — Livermore station.)
- Public schools. Livermore is served by the Livermore Valley Joint Unified School District (LVJUSD). (LVJUSD.) I do not publish relative school rankings in this post — California Department of Education SARC reports and individual district pages are the primary sources for a newcomer comparing schools across Tri-Valley cities.
Commute times, demographic statistics, household income figures, and employer headcounts vary enough across public sources that I will not cite a single number without a direct reference. If any of these matter to your decision, the U.S. Census Bureau’s American Community Survey is the primary source I would point a client to.
What the Data Does and Does Not Support for a Newcomer
What the data does support:
- Livermore is the most affordable of the four Tri-Valley cities on a median-price basis, by a margin of roughly $238,000 to $343,000 in March 2026.
- Livermore’s pace — 15-day DOM, 103% sale-to-list, 2.0 months of supply — is as competitive as Pleasanton and San Ramon. Expect to move fast on a property you want.
- The market cooled modestly into early 2026: median −3.0% YoY, $/SqFt −3.9% YoY at the March 2026 reading.
- The softest negotiating windows in Livermore historically fall in November, December, and January, when inventory thins but competition thins faster.
- On a per-square-foot basis, Livermore is tied with Dublin and materially below San Ramon and Pleasanton. The total-price gap is driven largely by home size, not purely by per-foot pricing.
What the data does not support — and what I will not invent:
- A specific forecast for 2027 Livermore prices. Two months of softening is not enough signal to project a year out; macro rate moves would dominate any local model.
- Claims about relative school quality, commute times, crime, or “lifestyle” across Tri-Valley cities. These require Census, CDE, FBI UCR, or Caltrans data, not MLS records.
- Attached-housing (condo and townhome) figures for Livermore. The Bay East monthly reports I have access to cover detached single-family homes only. If your search includes attached product, ask for a data pull specific to that segment before comparing it to detached numbers.
Practical Takeaways for an Incoming Buyer
For buyers relocating from lower-cost metros: expect your per-square-foot dollars to go the farthest in Livermore or Dublin, but the total-dollar savings to be largest in Livermore. The 2.0 months of supply reading tells you to be pre-approved, reserve-ready, and decisive on the first viewing of a well-priced home — not to assume the slower pace of your previous market applies here.
For buyers with timing flexibility: if your move-in date is negotiable, the November–January window historically gives you the most negotiating leverage in Livermore. DOM runs 28–35 days in those months versus 15–17 in the spring, and active-to-sold ratios are more buyer-favorable.
For buyers weighing Livermore against Pleasanton, Dublin, or San Ramon: the cross-city comparison table is your starting point, but the second question worth asking is what you are buying per dollar: larger square footage, different commute patterns, different school-district boundaries. Any agent quoting only the headline median without the supporting supply, DOM, and $/SqFt context is leaving you with half the picture.
Methodology Note
This post analyzes 231 monthly observations of single-family detached homes in Livermore, California, drawn from Bay East Association of REALTORS® monthly market reports for the period January 2007 through March 2026. Cross-city comparisons use the corresponding Bay East monthly files for Pleasanton detached, Dublin detached, and San Ramon detached homes, using the most recent month available for each city at the time of writing (March 2026 for Pleasanton and Livermore; February 2026 for Dublin and San Ramon). Attached-housing data (condos and townhomes) is not included because my Bay East source files for Livermore cover detached homes only — if your search includes attached product, those figures would come from a separate report and are not stated or implied here. Seasonality averages are computed over calendar years 2015–2019 and 2023–2024, deliberately excluding the COVID Anomaly window (2020–2022) to avoid period-specific distortion. Figures are cited to the exact value in the Bay East source; year-over-year percent changes are computed from those figures. Data QC flags from the extraction: (1) the January 2007 listed-$/SqFt field is blank in the pre-2008 Bay East format and is not used in any claim above; (2) the 2026 “annual” figures cited above cover January through March only and are labeled as year-to-date, not annual.
Work With a Buyer’s Agent Who Knows the Tri-Valley Data
Moving to a new metro is a decision that data can inform but cannot make for you. What I can do is put the full 19-year series in front of you, show you where your target price and timing fit inside it, and run the numbers on specific homes you are considering — before offer strategy, not after.
Ready to talk through your Livermore (or broader Tri-Valley) options? I work with relocating buyers across Pleasanton, Dublin, San Ramon, and Livermore.
📩 Schedule a Free Buyer Consultation
- Bay East Association of REALTORS® — Monthly Market Activity Reports (2007–2026, Livermore / Pleasanton / Dublin / San Ramon, single-family detached).
- Lawrence Livermore National Laboratory — About
- Sandia National Laboratories — Livermore Site
- TTB — Established American Viticultural Areas
- Livermore Valley Wine Country
- Bay Area Rapid Transit — Station List
- Altamont Corridor Express — Livermore Station
- Livermore Valley Joint Unified School District
- U.S. Census Bureau — American Community Survey
- Related DrXSong posts: Tri-Valley Home Buying Guide (barbell strategy); Pleasanton March 2026 Market Update; Tri-Valley Listing Agent Performance (263 closings).
Leave a Reply