
Thirty-seven detached homes closed in Pleasanton in August 2026, and the average price per square foot rose 1.1% from a year earlier — the first year-over-year gain since March 2025. Over the same summer, June through August produced 116 closings, the fewest of any summer in the Bay East record going back to 2007. Those two facts are usually read as contradictory. This update tests whether they are.
Three readings of the Pleasanton market circulate right now. The first says a seller’s market is turning balanced. The second says prices are close to breaking. The third says conditions have stabilized. Each is testable against nineteen years of Bay East monthly data, and the August numbers come down clearly on some of those questions and ambiguously on others.
I ran all three as explicit tests. What follows is what the data supports, what it rules out, and the one result that fits none of the three labels.
Price Held. Transactions Did Not.
The chart below plots two series that moved together for most of the last two decades. The navy line is the six-month average of sold price per square foot, read on the left axis. The red line is the twelve-month average of monthly closings, read on the right.
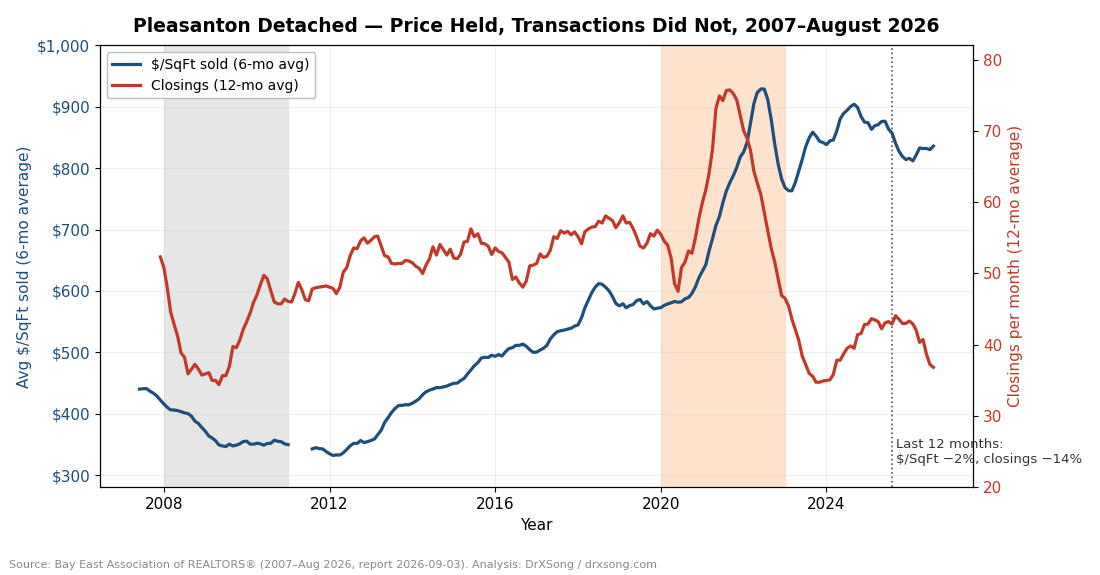
Through the Financial Crisis, the Long Recovery, and the COVID Anomaly, price and volume turned together. They fell together in 2008. They climbed together from 2012. They spiked together in 2021. After 2023 they separate, and the gap has widened every quarter since.
The numbers behind the split are narrow on one side and wide on the other. Over the twelve months ending in August, the six-month $/SqFt average moved from $857 to $836, a decline of 2.5%. Over the same twelve months, the rolling closings average fell from 42.9 per month to 36.8, a decline of 14.2%.
How flat is flat?
Precision matters here, because “stable” is easy to assert and harder to measure. The six-month $/SqFt average has held a band of $812 to $841 for twelve consecutive months. That is a spread of $29, or 3.6%. The preceding twelve months ran $857 to $904 — a wider spread, and one that trended down throughout rather than oscillating inside a range.
The monthly year-over-year figures tell the same story from a different angle. April 2025 through June 2026 produced fifteen consecutive months of year-over-year decline in $/SqFt. July 2026 broke that streak at exactly zero — $803, matching July 2025 to the dollar. August turned positive at $836 against $827. Two months is not a trend, and I would not call this a floor on the strength of it. But the direction of the change is not ambiguous.
For context against my earlier work, the 19-year $/SqFt trend and 2027 forecast projected a 2026 band of $860 to $963. August’s $836 prints below the lower bound of that band, as May’s and June’s did. The forecast has been running ahead of actual all year, and I will revisit the model when the full-year data is in.
The Same Market Tightness as 2019, With 39% Fewer Sales
If price is steady and volume is not, the natural question is whether the market has loosened or simply emptied. Those are different conditions and they call for different strategies. The cleanest way to separate them is to find a past year with similar supply conditions and compare transaction counts.
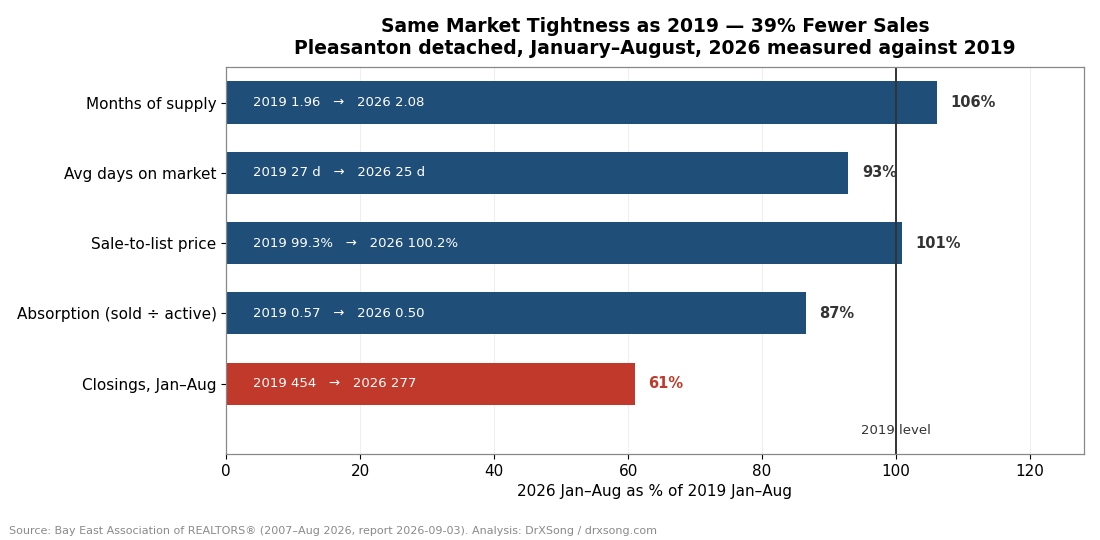
That year is 2019 — the last full pre-COVID year in which Pleasanton ran genuinely loose by the standards of the decade that followed. The comparison below covers January through August in both years.
| Measure (Jan–Aug) | 2019 | 2026 | 2026 as % of 2019 |
|---|---|---|---|
| Months of supply (avg) | 1.96 | 2.08 | 106% |
| Average days on market | 27 | 25 | 93% |
| Sale-to-list price (avg) | 99.3% | 100.2% | 101% |
| Absorption (sold ÷ active) | 0.57 | 0.50 | 87% |
| Closings | 454 | 277 | 61% |
Four of the five measures land within 13% of their 2019 levels. Homes are selling about as fast, at about the same fraction of list price, against about the same months of supply. By every ratio a buyer or seller would normally consult, 2026 looks like 2019.
The fifth measure does not. Pleasanton closed 454 detached homes in the first eight months of 2019 and 277 in the first eight months of 2026 — 177 fewer sales, a 39% reduction, with market tightness essentially unchanged.
That combination has a specific mechanical explanation. Ratios like months of supply and absorption are quotients: buyers over sellers, roughly speaking. When both sides of a market shrink by similar proportions, the quotient barely moves even as the market itself hollows out. Fewer people listed, fewer people bought, and the measures that describe the relationship between them stayed put.
Testing the Crash Hypothesis
A record-low summer invites comparison to 2008, so it is worth checking that comparison against the actual crisis data rather than against memory. Two measures separate a market that is thin from a market that is breaking: whether unsold inventory accumulates, and whether sellers hold their asking prices.

On inventory accumulation, the two periods are not comparable. Months of supply reached or exceeded the 3.0-month balanced-market threshold in 29 of the 48 months from 2008 through 2011, and peaked at 9.2. In 2026, not one month has reached 3.0. The high was 2.6 in April, and August stands at 1.9.
Active inventory has fallen year-over-year in every month of 2026 — by 5% in January, 32% in February, 30% in March, 33% in April, 28% in May, 8% in June, 11% in July, and 20% in August. A market that is breaking accumulates unsold homes. This one is shedding them, because sellers are withdrawing at roughly the rate buyers are.
On pricing discipline, the gap is equally wide. Sale-to-list averaged 95.3% across 2008–2011, bottomed at 82.2% in December 2010, and printed below 98% in 45 of those 48 months. Every month of 2026 has printed between 98% and 103%. Not one month this year has closed below 98% of list.
The drawdown comparison completes the picture. Pleasanton’s $/SqFt fell from $452 to $323 peak-to-trough during the crisis, a decline of 28.5%. August 2026’s $836 sits 10.2% below the August 2024 high of $931 and 16.8% below the all-time peak of $1,005 set in April 2022.
Nothing in these three measures resembles 2008. That is a statement about supply behavior and pricing discipline, not a forecast — a market can deteriorate from here, and these indicators would move before prices did.
Where the Missing Transactions Were
The thinning is not evenly distributed across price bands. Two measures locate it at the top of the market.
The first is the spread between average and median sale price. From January 2024 through June 2026, Pleasanton’s average sale price ran 17.1% above the median — a gap produced by a steady flow of high-end closings pulling the average upward. In July 2026 that spread collapsed to 3.7%, and in August it was 7.3%. The high-end closings that had been lifting the average largely stopped.
The second is the year-to-date tier distribution. Sales above $2,000,000 accounted for 39.7% of January–August closings in 2024, 33.9% in 2025, and 29.6% in 2026. Sales above $3,000,000 numbered 49 in 2024, 40 in 2025, and 29 this year.
This is also why August’s headline median fell 9.7% year-over-year while $/SqFt rose 1.1%. The median dropped because the mix shifted downward, not because comparable homes repriced — the same mix-shift dynamic I flagged in the May 2026 update, running in the opposite direction. Reading the median alone would have produced the wrong conclusion in both months.
The rate backdrop
One external factor bears directly on transaction counts. Freddie Mac’s Primary Mortgage Market Survey put the 30-year fixed-rate average at 6.76% on September 10, 2026, up from 6.71% the prior week and 6.35% a year earlier. Financing costs are roughly 40 basis points higher than they were during last year’s selling season.
I want to be careful about how far to push that. The correlation between rates and Pleasanton transaction volume over this period is consistent with the pattern, but this data cannot establish that rates caused the volume decline. Employment conditions in the Bay Area technology sector, equity compensation values, and relocation patterns all bear on the same outcome and are not captured in Bay East data.
What Two Months Cannot Settle
Three limits are worth stating plainly.
First, July and August are two observations. A twelve-month band of $812 to $841 is a factual description of where the six-month average has traveled; it is not evidence that the band will hold. The honest position is that the fifteen-month run of year-over-year declines has stopped, and that whether it has stopped durably is unknown.
Second, the September and October data will be more informative than usual. Pleasanton’s autumn months historically carry the year’s softest negotiating conditions — the Tri-Valley buyer-timing analysis found the within-year $/SqFt index bottoming in December and sale-to-list running 1.7 to 1.9 percentage points below the spring peak in late fall. If the recent stability holds through a seasonally weak stretch, that is a stronger signal than two summer months provide.
Third, this analysis uses Bay East aggregate data only, which means it cannot address within-tier competition, floor-plan effects, or concession patterns. Those require a property-level MLS export, which I did not pull for July or August. The tier and story-type analysis and the June 2026 update cover that ground through June.
Practical Takeaways
For buyers: The competitive conditions have not loosened the way the transaction count suggests. Average days on market of 36 in August is the slowest August since 2019, but months of supply at 1.9 and sale-to-list at 99% describe a market where well-priced homes still clear. Expect to negotiate at the margin rather than at a discount. The one segment where the data shows genuine change is above $2,000,000, where the closing share has fallen for two consecutive years and the buyer pool is measurably thinner.
For sellers: Pricing discipline is doing the work. No month in 2026 has closed below 98% of list, which means the market is still rewarding accurate pricing and has not started forcing broad concessions. My study of 191 closed sales measured what happens when that discipline slips: homes that sat 30 days or longer closed 8.1% below list against 1.5% for properly priced listings. With fewer buyers in the market, the penalty for an aspirational list price lands on a smaller pool.
For both: Watch the closing count, not the median. August’s median fell 9.7% year-over-year while price per square foot rose 1.1%. The two measures answered different questions, and only one of them described what a comparable home is worth.
Methodology
All figures come from Bay East Association of REALTORS® monthly market activity reports for Pleasanton detached single-family homes, covering January 2007 through August 2026, as published in the September 3, 2026 county report. The Bay East Pleasanton series includes Sunol. Price per square foot is the reported monthly average of sold transactions; the six-month rolling average is used for trend statements and the twelve-month rolling average for closings and months of supply, per my standard practice. The Financial Crisis (2008–2010) and COVID Anomaly (2020–2022) windows are shaded on all multi-year charts.
Three data notes apply to this update.
First, unlike the June update, every figure here comes from Bay East alone. No property-level MLS export was pulled for July or August, so the current-month values are Bay East aggregates rather than the MLS-export figures used in prior monthly posts. Where the two sources differ, the difference is definitional: MLS exports in earlier posts were Pleasanton-only, while Bay East includes Sunol.
Second, Bay East revises recent months as late listings report. June 2026 closings were reported as 33 in the June update, drawn from a preliminary MLS export; the Bay East final is 38. June active inventory was reported as 75 from that export and now stands at 98 in Bay East data, after an upward revision from an initially published 90. Active-listing counts for the two most recent months should be treated as provisional. May 2026 $/SqFt appears here as $810, the Bay East figure, rather than the $822 MLS-export value cited in the May update.
Third, no regression or forecast model is used in this post. The comparisons are direct period-over-period measurements. The 2026 forecast band referenced above comes from the quadratic and linear models described in the $/SqFt trend and forecast analysis, which excluded the COVID window from trend fitting.
Work With a Buyer’s Agent Who Tests the Claim
Market commentary this season will describe Pleasanton as cooling, crashing, or recovering, and each description can be supported by selecting one measure and ignoring the others. The median fell 9.7%. Price per square foot rose 1.1%. Closings hit a nineteen-year summer low. Months of supply stayed under 2.0. All four are accurate.
My work is built on running those measures against the full historical series before drawing a conclusion, and on saying plainly when the data cannot settle a question. If you are weighing a purchase or a sale in Pleasanton, Dublin, San Ramon, or Livermore, I can walk you through what the numbers support for your specific price band and timeline.
Ready to talk through your options? There is no obligation and no pressure to move on any particular timeline.
📩 Schedule a Free Buyer Consultation
- Bay East Association of REALTORS® — Monthly Market Activity, Pleasanton Detached Single-Family Homes, January 2007 – August 2026 (county report dated September 3, 2026)
- Freddie Mac Primary Mortgage Market Survey — 30-year fixed-rate average, September 10, 2026
- Pleasanton Detached Homes — June 2026 Update
- Pleasanton May 2026 Market Update
- Pleasanton April 2026 Market Update
- Pleasanton March 2026 Market Update
- Pleasanton Home Prices Trend & 2027 Forecast
- Pleasanton Home Pricing: 191 Sales Expose the True Cost of Overpricing
- Pleasanton Detached Home Prices by Tier and Story Type
- Tri-Valley Buyer Timing: When to Make Your Offer
- Alameda County Housing Market 2026
Leave a Reply