
April 2026 detached single-family prices in Pleasanton printed $897 per square foot. But only 29 homes closed, the lowest band of monthly volume outside the 2008–2010 crisis. Two years of price round-trip; volume that hasn’t recovered.
If you’ve been watching Pleasanton numbers month-to-month, the April print looks like two contradictory stories at once. Per-square-foot pricing came in essentially flat with March and posted the first positive April year-over-year reading in four years. At the same time, the count of closed transactions stayed in the depressed band the city has been in since 2023. Both are true. Together they describe a different kind of market than the one most narratives still assume.
Below: the year-over-year heatmap, the 19-year price arc, the volume series, and the days-on-market series. Then what the four together actually mean for a Pleasanton buyer or seller right now.
The $/SqFt Heatmap: April Turns Green for the First Time Since 2022
Each cell is the year-over-year percent change in average sold $/SqFt for that month compared to the same month one year earlier. Green = appreciation; red = depreciation. The April 2026 cell prints +1.4% — modest, but the first April-row green-tint reading in the post-COVID period.
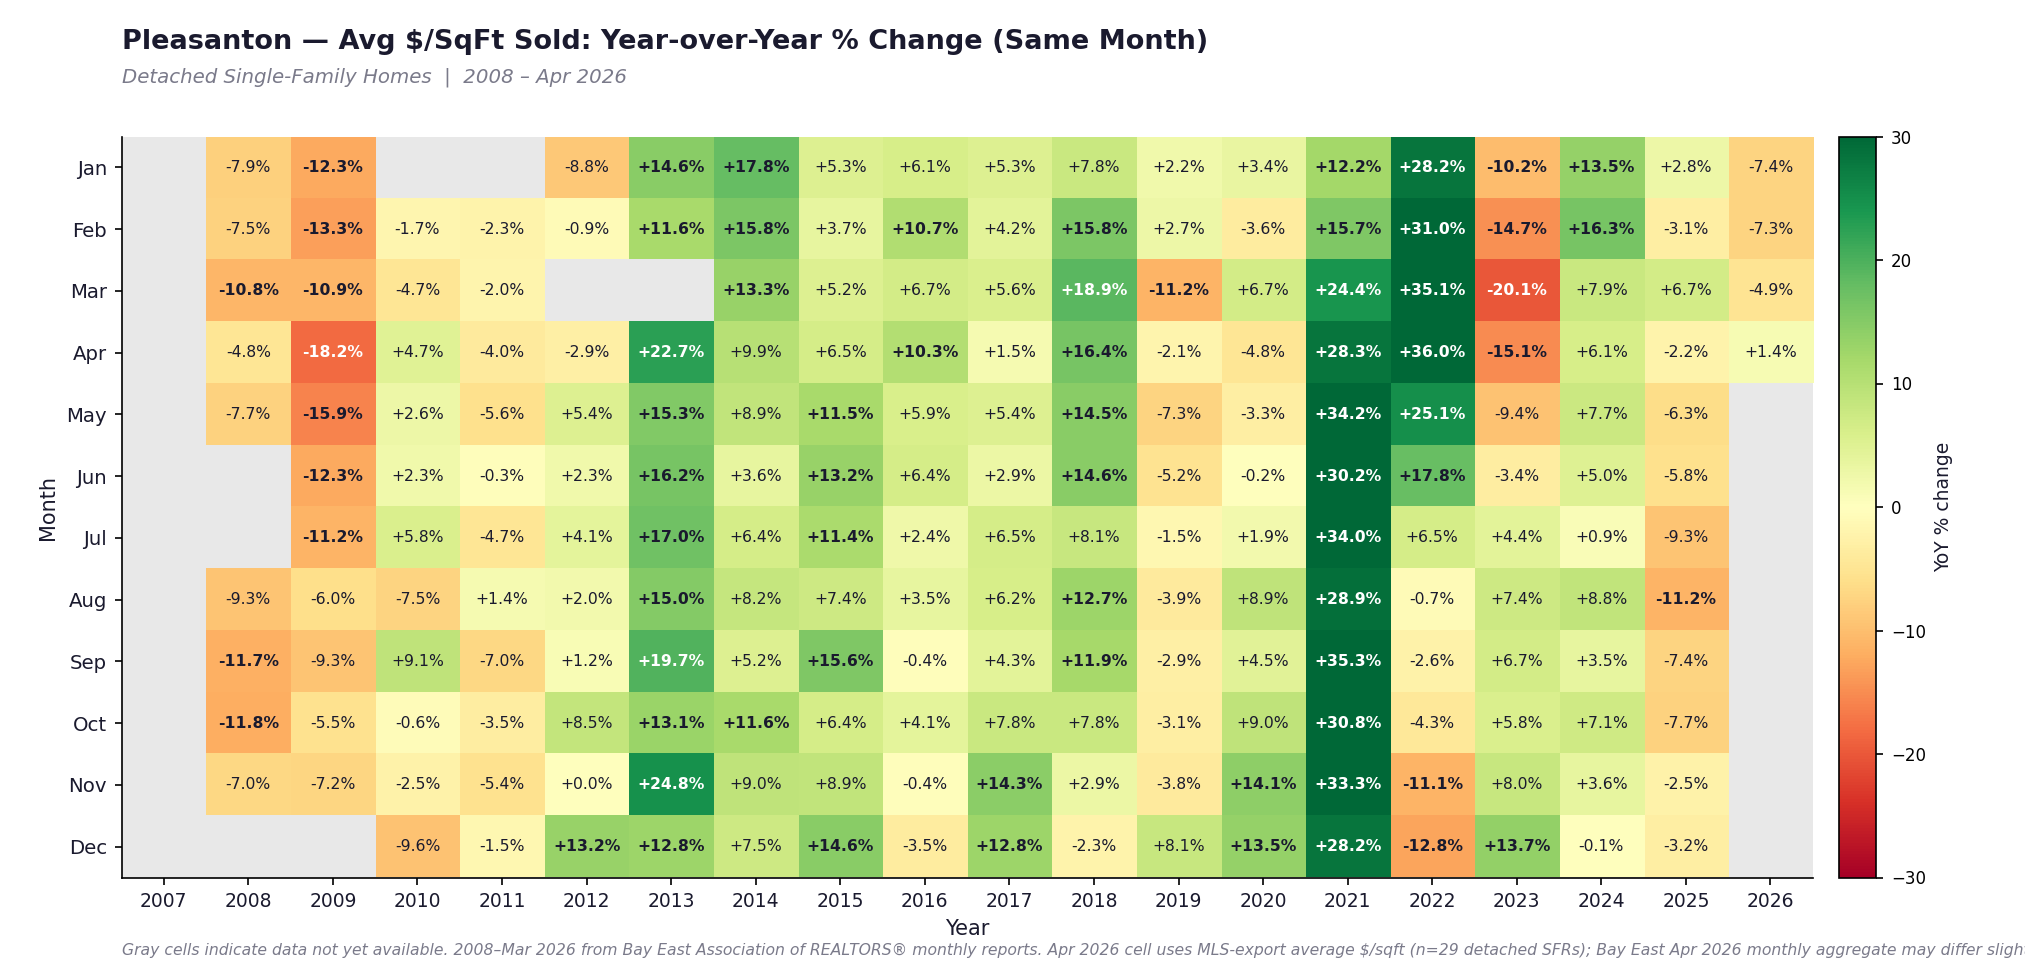
Reading down the April row: 2022 was the +25% blow-off top of the COVID period. 2023 was the rate-shock correction (–9.4% in May, similar magnitudes through that summer). 2024 was a partial recovery (+7.7%). 2025 was a give-back (–6.3%). 2026 is back to slightly positive — and the absolute level ($897) is within $8 of April 2024 ($905). Two years of motion that net to less than 1% in either direction.
The first quarter of 2026 was negative across the board — January –7.4%, February –7.3%, March –4.9% — so April’s flip to positive is the first month this year where the year-over-year reading didn’t drag. One month does not make a turn. But it does break a trailing pattern.
The 19-Year Price Arc
The same data, plotted as a time series, makes the recent stability easier to see. Below: monthly average $/SqFt with a six-month rolling average overlaid. Financial Crisis (2008–2010) and COVID Anomaly (2020–Q2 2022) windows are shaded.

The chart shows three distinct chapters. The Long Recovery from the 2011 trough ($237/sqft) through 2019 was a steady climb of roughly $40 per square foot per year. The COVID Anomaly compressed five years of price gain into 18 months, peaking at $1,005 in April 2022. The Rate-Shock Correction pulled prices back to the high-$700s by mid-2023.
What’s happened since the 2023 trough is a flat-with-volatility band. The smoothed line has been trading in a roughly $830–$900 range for the last 30 months. April 2026 at $897 sits at the high end of that band but inside it. We are not making new highs. We are also not breaking down. The signal here is “stable,” not “appreciating.”
One useful frame: the current $897 is 10.7% below the all-time April peak ($1,005 in April 2022) but only 1.8% below the most recent 12-month peak ($913 in March 2025). The market has been holding within a narrow band near the recent ceiling for over a year.
Volume Tells the Other Half of the Story
Monthly closed sales of Pleasanton detached SFRs paint a very different picture from the price chart. Below: monthly closings as bars, with a 12-month rolling average overlaid.
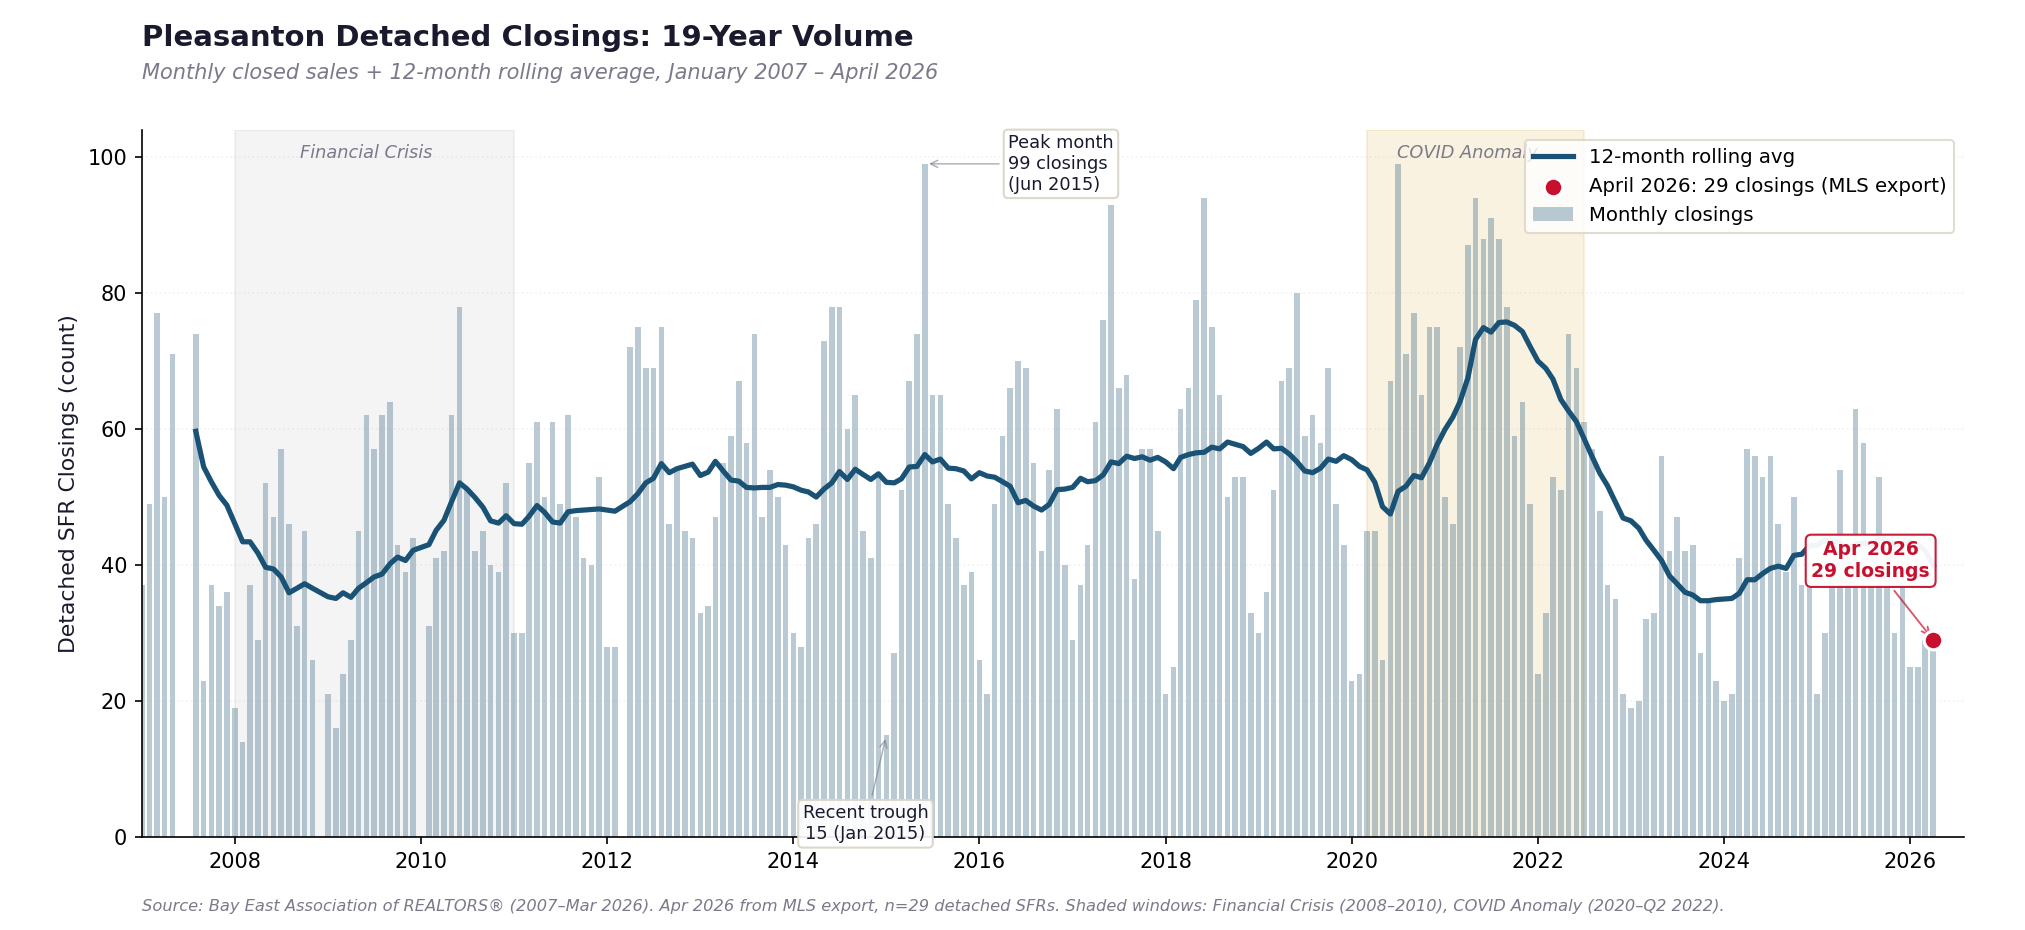
For most of the 2013–2019 recovery period, the 12-month rolling average ran 50–60 closings per month. The spring months of an active year regularly cleared 70–90. The peak single month in this 19-year series was 99 closings (June 2015).
That cadence is gone. The rolling average has been drifting in a 30–45 band since 2023. Annual closings: roughly 515 in 2025, 516 in 2024, with 2023 at the trough of 419. By comparison, 2018 cleared 720+ detached SFRs. The current run rate is about 30% below the pre-COVID annual cadence.
April 2026’s 29 closings is light even by current standards — April is normally one of the stronger months of the year in Pleasanton, both for new listings hitting the market and for buyer demand. A month at 29 closings during what should be the seasonal peak is the volume story in one number.
Two structural forces are doing most of the work here. First, the rate-lock effect — homeowners who refinanced or bought in the 2.5–3.5% rate window have a strong financial reason not to list, because moving means giving up that rate for one near 6.5%. Second, affordability — entry-level buyer households that would have bought in 2018 at $1.0M with a 4% rate now face $1.4M at 6.5%, and many simply cannot. Both forces compress the transaction count without compressing the price level. That is exactly what the two charts together show.
Days on Market: The Listings That Do Trade Are Trading Fast

April 2026 averaged 11.6 days on market across the 29 detached closings, with a median of 8 days. To put that in context: the 19-year peak in average DOM was 191 days (June 2011, deep in the post-crisis hangover). The pre-COVID years 2013–2019 typically ran 20–35 days average DOM. The current sub-30 days reading has held since mid-2023.
This is the part of the data that constrains the easy “buyer’s market” reading. Even though volume is low and the broader macro environment is unfavorable, the homes that actually do come to market — when priced reasonably — clear in roughly a week. A market with 8-day median DOM is not a market where buyers can take their time. Per-listing competition is intense; per-month transaction count is light. Both at the same time.
What the Four Charts Together Say: A Frozen-but-Firm Market
The four charts above are showing complementary slices of the same single phenomenon. Pricing power has held — not because demand is roaring back, but because the supply that reaches the market is so constrained that the demand which does exist is concentrated against a small number of homes. Each individual transaction is competitive; the count of transactions is depressed.
This is structurally different from both prior cycles in the 19-year record. The 2008–2010 crisis was a market where prices fell and volume fell, because forced selling met evaporated demand. The 2020–2022 COVID anomaly was a market where prices rose and volume rose, because cheap money met restocking demand from buyers who could finally win bids. The 2024–2026 environment is a third pattern: prices defended, volume rationed. The data does not show a fourth path emerging yet.
The question worth asking — and the question I cannot answer with the data on hand — is how long this configuration is sustainable. A market that holds its price level on declining volume eventually has to resolve in one of two directions. Either inventory increases (which would test whether the demand pool is actually as resilient as the per-listing competition suggests) or rates ease enough to thaw the rate-lock effect (which would unlock both supply and additional demand simultaneously). One month of data cannot tell us which way that resolves. The April reading is consistent with the band continuing to hold.
Practical Takeaways
For buyers: The “April price break” some buyers were waiting for did not arrive. Year-over-year went positive. Do not bring a strategy built on the assumption that prices are softening — the data does not support that read. Where there is leverage in this market is at the margin, not the headline. Of the 29 April closings, the ones that took 15+ days to close traded at a median 2.5% under list. Concessions at close were present in roughly a third of the closings I have data for, with the heaviest concentration in the $1.8–2.2M tier. Both signal that sellers are increasingly willing to trade closing-cost or rate-buydown credits for headline price preservation. That is your opening.
For sellers: Pricing has not deteriorated. April’s $/SqFt is within $8 of where it was two Aprils ago and 1.4% above one year ago. If your circumstances point to listing, the data does not argue for waiting in hope of a stronger market — it argues the market is already at the high end of its 30-month range. The penalty for overpricing in this environment is well-documented (see the 191-sales overpricing study from earlier this year). Eight-day median DOM means properly priced homes go quickly; the homes that drift past two weeks are the ones that take material discounts. Price for what the comparables show, not for what you hope the market will become.
For everyone watching the cycle: Two metrics in the same dataset can point in opposite directions and both be telling the truth. A market with rising prices and falling volume is not a market in trouble; it is a market in a different mode. Whether that mode persists is the question May, June, and July’s data will start to answer.
Methodology
Historical $/SqFt, monthly closings, and average days on market for Pleasanton detached single-family homes (2007–March 2026) are sourced from the Bay East Association of REALTORS® monthly market reports. April 2026 figures are derived from a Pleasanton MLS detached-sold export covering closings between April 3 and April 30, 2026. The export contained 31 records; two are excluded from the analysis presented here — one Sold Off Market (status “SOM”) record with no reported sale price, and one strategic-underpricing outlier (a 1,592 sqft home that closed at +24.3% over an unusually low list price). Working sample is therefore n=29. The April 2026 $/SqFt value plotted on the heatmap and trend chart is the simple mean of sale-price-per-square-foot across those 29 closings ($897); it is comparable in methodology to the Bay East “Avg $/SqFt Sold” figure but may differ slightly when the official Bay East April 2026 report is published. The $/SqFt trend uses a 6-month rolling average (per drxsong.com methodology standard); the closings count uses a 12-month rolling average; the days-on-market line uses a 6-month rolling average. Cells and time-series points from May 2026 forward are intentionally blank — data is not yet available. Year-over-year heatmap calculations use same-month comparisons and do not forward-fill missing values.
Work With a Buyer’s Agent Who Reads Both Numbers
Most market commentary on Pleasanton this spring has anchored on either the pricing number or the volume number — rarely both. The two metrics together tell a more useful story than either alone. If you are buying or selling in Pleasanton, Dublin, or San Ramon, the right strategy depends on which side of that “frozen but firm” pattern you are on, what tier of the market you are in, and how the specific listing you are evaluating maps to the data.
Ready to talk through your options? A 30-minute conversation, no obligation, grounded in the actual numbers for your specific situation.
📩 Schedule a Free Buyer Consultation
- Bay East Association of REALTORS® — monthly market reports (Pleasanton, 2007–March 2026)
- Pleasanton MLS detached-sold export, April 2026 (n=29 closed transactions used in analysis; see methodology)
- Pleasanton March 2026 Market Update
- Pleasanton February 2026 Market Update
- Pleasanton Home Pricing: 191 Sales Expose the True Cost of Overpricing
- The Affordability Trap: 18 Years of Pleasanton Price Data
- Pleasanton Detached Home Prices by Tier and Story Type
Leave a Reply