
Forty-two detached homes closed in Pleasanton in May 2026. The median sale price jumped to $1,845,938 — up 8.7% from April, up 9.9% year-over-year. And yet the average price per square foot fell to $822, down 6.0% from April and down 5.2% from May 2025. Both readings are correct. The reason they disagree is the story of the month.
The headline median rose. The price-per-square-foot fell. Both at the same time can only happen one way — the mix of homes that closed shifted up the price ladder. In April, zero detached single-family homes traded above $3M in Pleasanton. In May, seven did, including three above $4M and one above $5M. Larger and luxury homes tend to price at lower $/SqFt than mid-range homes. When the mix tilts toward them, the headline median rises and the average $/SqFt falls. That is exactly what happened.
The other part of the story sits underneath: April’s hottest price tier — the $1.5–1.8M band — was May’s most-discounted band. The new heat is concentrated above $3M. This post walks through the four charts that frame the divergence: the 19-year context (heatmap and price arc), then the mix-shift and tier-flip that explain May specifically.
The $/SqFt Heatmap: May 2026 Snaps Back to Negative YoY
Each cell shows the year-over-year percent change in average sold $/SqFt for that month versus the same month one year earlier. Green = appreciation; red = depreciation. May 2026 prints –5.2% — the first May-row negative reading since the 2023 rate-shock correction, and a reversal of April’s narrow positive print.
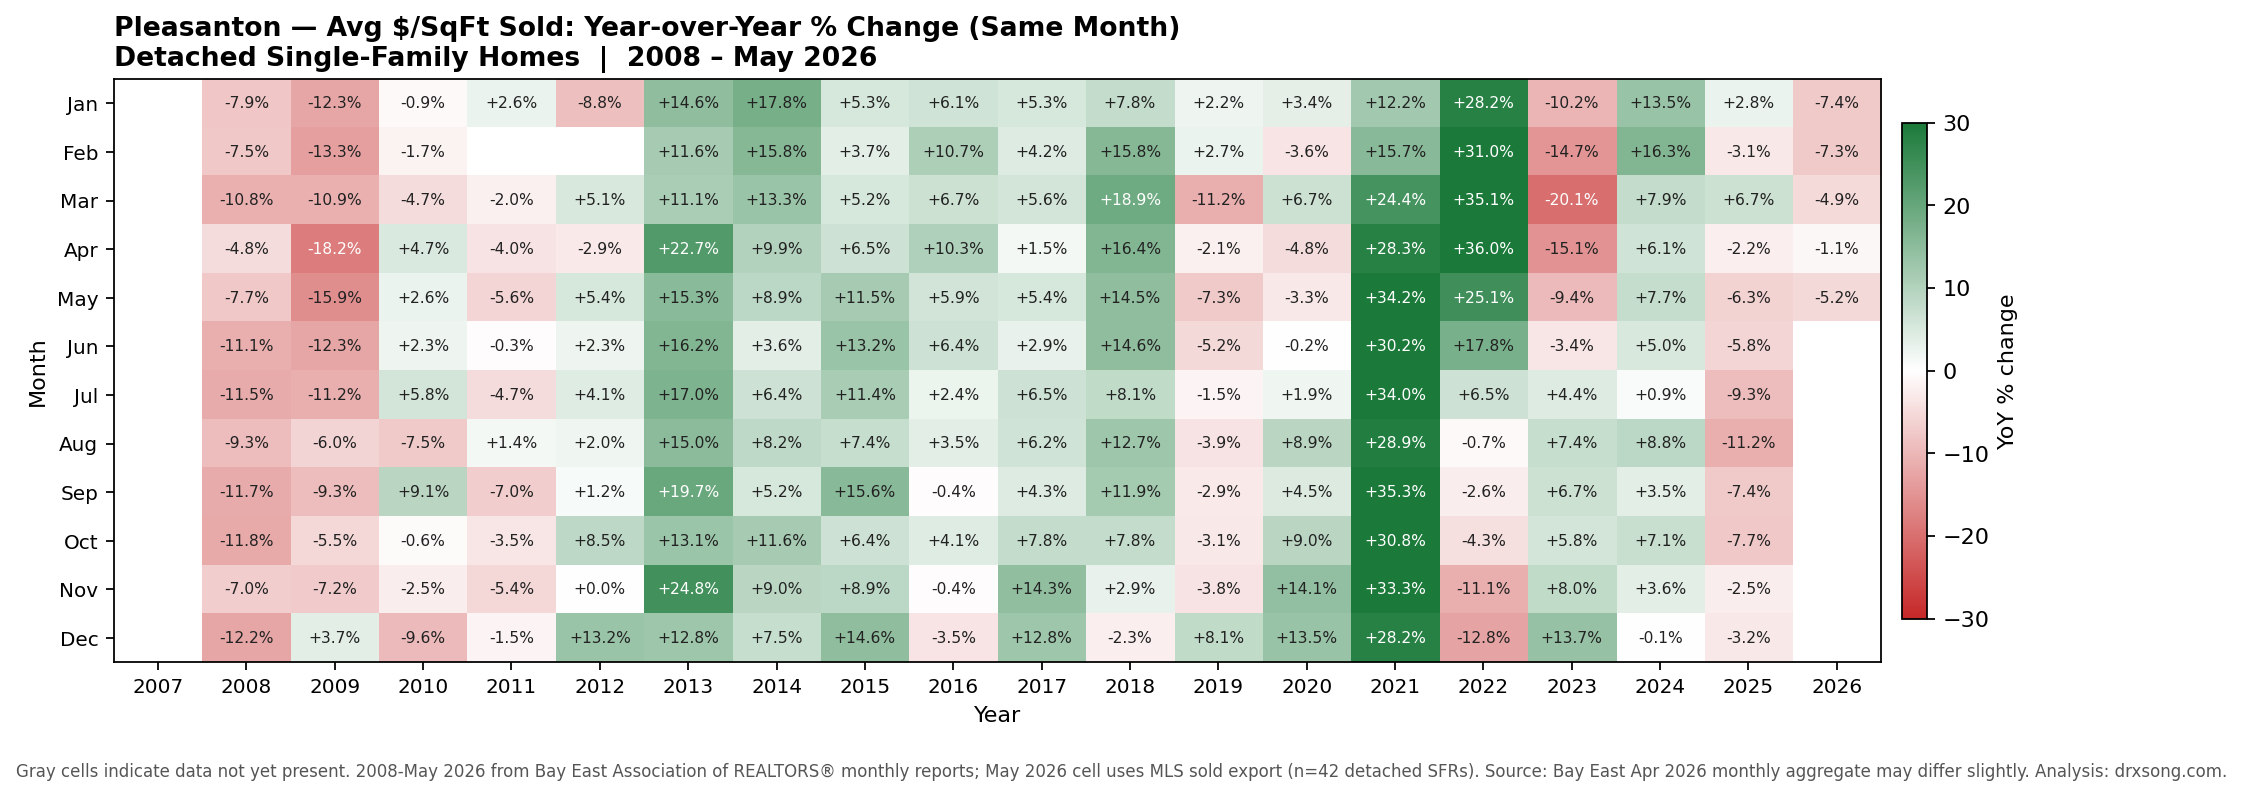
Reading down the May row: 2021 was +28% (the COVID surge); 2022 was +13% (the final blow-off); 2023 was –9% (the rate-shock correction); 2024 and 2025 were each within ±3%; May 2026 is –5.2%. The April–May pair this year is the first time since the COVID period began that two consecutive months printed on opposite sides of zero — April +0.5% (using Bay East’s $875 print for that month), May –5.2%. The April-row positive last month was thin; the May-row reversal is not surprising in that light.
The broader story the heatmap tells has not changed: the 2024–2026 stretch has been a narrow band of mostly single-digit moves in either direction, after the very large swings of 2020–2023. May 2026 sits inside that band, on the soft side of it.
The 19-Year $/SqFt Arc — May at $822
Plotted as a time series, the recent stability becomes easier to see. Below: monthly average $/SqFt with a six-month rolling average overlaid. Financial Crisis (2008–2010) and COVID Anomaly (2020–Q2 2022) windows are shaded.
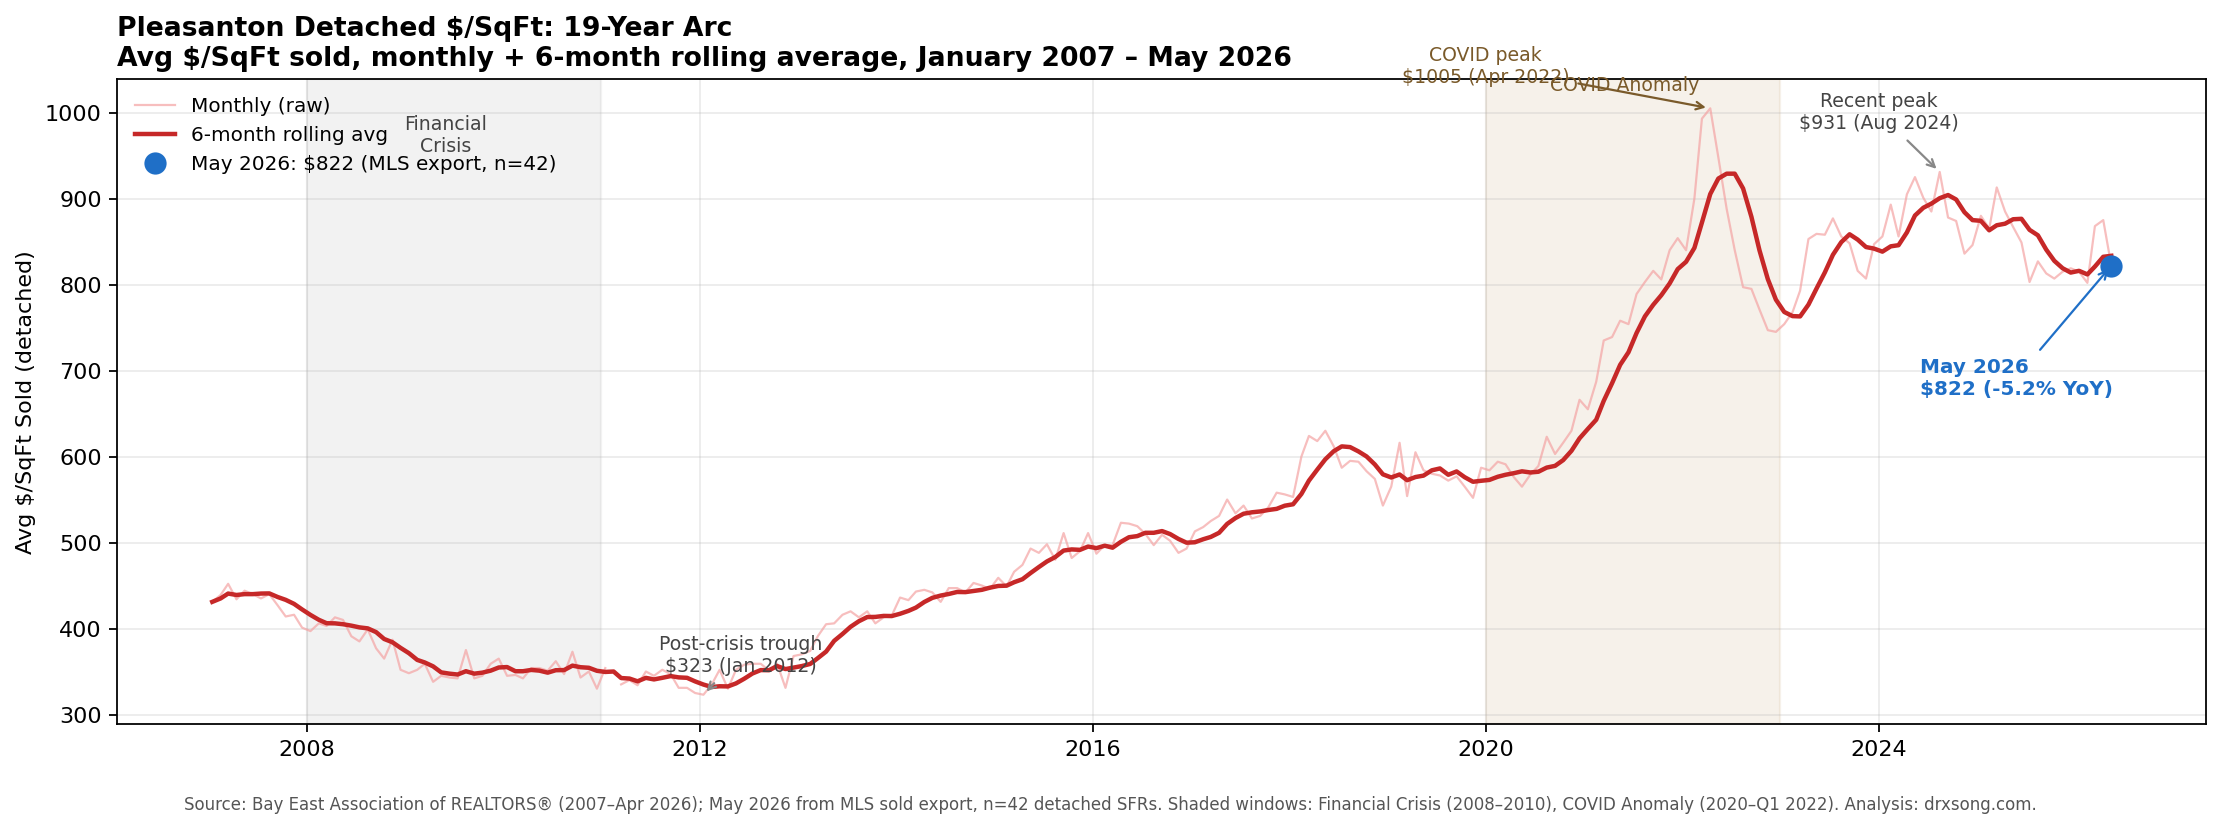
The 19-year arc still reads the same way it has for the last two years. The COVID Anomaly peaked at $1,005 per square foot in April 2022. The Rate-Shock Correction pulled the smoothed line back to the high-$700s by mid-2023. The recent peak at $913 in March 2025 is the high-water mark of the current cycle. May 2026 at $822 is 10.0% below that recent peak and 18.2% below the COVID peak.
What is worth noting: the six-month rolling average has been trading in a roughly $820–$910 range since the start of 2024. May 2026 at $822 sits at the lower end of that range, but inside it. This is not a breakdown of the price band — it is a print at the soft edge of a band that has held for 30 months.
For longer-run context on this band and what it implies, see Pleasanton’s 19-year $/sqft trend and 2027 forecast, which fitted both linear and quadratic models to the 2007–2026 data and bracketed the 2026 expected range at $860–$963. May 2026 at $822 prints below the bottom of that forecast band by about $38, or roughly 4%. One month does not invalidate a multi-year model; it does put the model on notice.
The Mix Shifted Up — That Is Why the Headline Moved
Here is the chart that explains the divergence between the median and the $/SqFt. It compares the share of closings by price tier in April versus May.
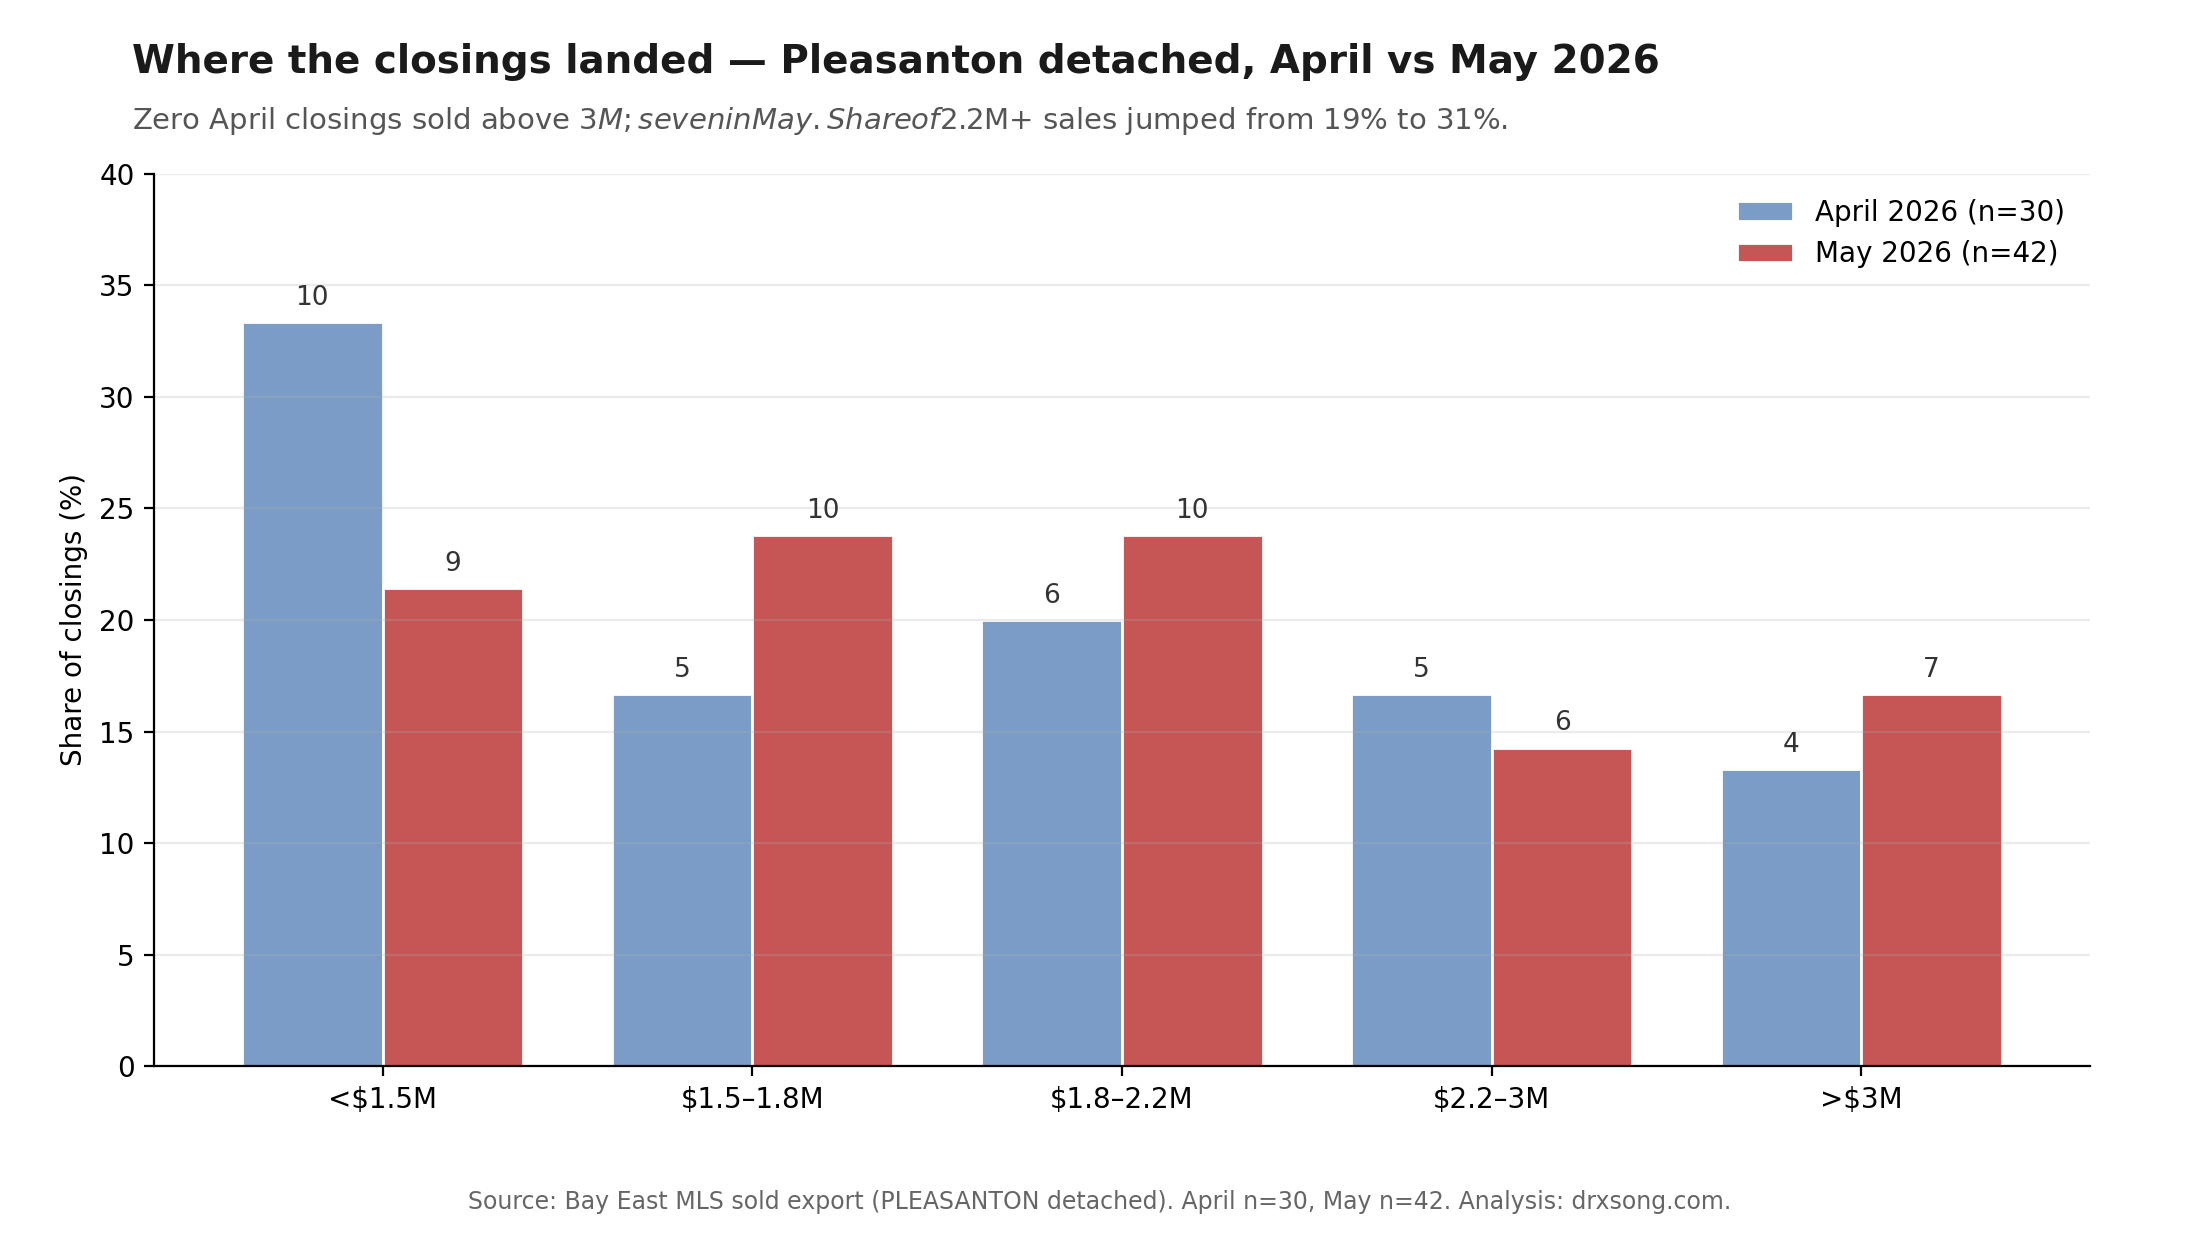
April 2026 had zero closings above $3M. May 2026 had seven — three above $4M, one above $5M ($5,060,000 on Lupine Ct). The share of closings above $2.2M nearly doubled, from 19% in April to 31% in May. The lower-tier band didn’t shrink in absolute terms — 9 closings under $1.5M in May versus 8 in April — but the larger May total meant the high-end share grew much faster than the low-end share.
Why does this drag $/SqFt down even as the median rises? Because price-per-square-foot is generally inverse to home size in Pleasanton. The seven >$3M closings in May had a median $/SqFt of $795 — below the citywide May average of $822 and well below the median $/SqFt of $897 in April 2026. The luxury tier prices at a lower number on a per-square-foot basis because it monetizes square footage less efficiently than the entry tier. When that tier’s share of the mix grows, the city-wide $/SqFt average falls — even as the home selling at $4M moves the median upward.
This is the same dynamic that drove the April post’s caveat about the median: the median number can move for reasons that have nothing to do with the price level of a given home. The $/SqFt is the cleaner signal. The May $/SqFt is down.
The Hot Zone Flipped — Where the Competition Is Now
The mix shift is half the story. The other half is what happened to competition within each tier. In April, the $1.5–1.8M band was the hottest segment of the market — 75% of closings sold over list, with a median sale-to-list ratio of 101.9%. In May, that same tier cooled to 40% over list and a median S/L of 96.9%, the lowest of any tier in the city.

Reading across the tiers in May: under $1.5M sold at 97.2% S/L with 22% over list; $1.5–1.8M at 96.9% S/L with 40% over list; $1.8–2.2M at 99.9% S/L with 30% over; $2.2–3M at 100.1% S/L with 50% over; and above $3M at 103.1% S/L with 86% over (6 of 7). The competition gradient now runs from cool at the bottom to hot at the top, almost monotonically. That is a different shape than the April 2026 data, where the $1.5–1.8M tier formed a hot pocket in the middle of an otherwise mixed picture.
What is driving this? Two factors are visible in the closing-level data. First, twelve May closings were carryover listings — homes first listed in January, February, or March that took 30 to 77 days to close, with a median sale-to-list ratio of about 97% on that cohort. Most of those carryover sales fell in the $1.3M–$2.2M range, which is exactly the tier band that softened in May’s per-tier S/L numbers. Stale inventory clearing at a discount is a real component of the May tier breakdown.
Second, the >$3M tier closed in May was, in roughly half the cases, recently listed — median days on market for that tier was 8. These are not stale listings finding new buyers at a markdown. They are new listings finding aggressive buyers at the asking price or above. Whatever is driving demand at the top of Pleasanton’s detached market right now, it is not the same force soaking up the middle of the market.
What the Four Charts Together Say
April’s data described a “frozen but firm” market — pricing held, volume didn’t. May’s data adds detail to that picture without overturning it. Volume recovered (42 closings is essentially May 2025’s 44), but the recovery was concentrated at the top of the market. The middle tier — the band that had been the hottest pocket of the city in April — cooled enough to widen the discount on the homes that finally cleared. The bottom tier remained competitive on a per-listing basis but did not expand. The top of the market is where May’s marginal buyer showed up.
The narrative implication is worth being careful about. A reasonable observer might read “$/SqFt fell 6%, median DOM nearly doubled” and conclude the Pleasanton detached market is rolling over. The per-tier and per-listing data do not support that read. Half of May’s closings (21 of 42) sold in 14 days or less. Six of seven closings over $3M went over list, with the highest single sale closing at 111.3% of asking. What the data more accurately describes is a market where the broad headline measures are softer but the per-tier competition pattern has shifted — not collapsed.
The harder question is whether this pattern persists. A market where headline measures soften while the top tier tightens is not common in the Pleasanton 19-year record. Two more months of data (June and July typically have the year’s heaviest seasonal closings) will start to answer whether May was a one-month mix anomaly or a shift in where demand is concentrated.
Practical Takeaways
For buyers: If your search is in the $1.3M–$2.2M band, May’s data shows leverage you did not have in April. The $1.5–1.8M tier in particular went from 75% of homes selling over list (April) to only 40% (May), with a median sale-to-list ratio of 96.9%. Twelve of May’s closings were Jan–March listings finally clearing — a sign that inventory is no longer disappearing in days at this price point. If you are considering a home that has been on the market for two weeks or longer, asking-price offers are realistic and below-asking is on the table. The data does not support that same posture above $2.2M, and definitely not above $3M — at that level the competition pattern still favors sellers.
For sellers: The signal depends on which tier your home sits in. Above $3M, May 2026 was the strongest month of 2026 to date — six of seven listings closed over asking, including one at 111.3% of list. Pricing aggressively is supported by the data at the top of the market. Below $2.2M, the data is the other way. The homes that drifted past 14 days on market in May closed at a median 97% of asking. Anchoring on April’s $1.5–1.8M heat as a pricing reference will produce the same DOM drag the prior 191-sales overpricing study documented — see 191 sales expose the true cost of overpricing for the magnitudes. Price for what the comparables show in May, not what they showed in April.
For everyone watching the cycle: Median sale price is the most-cited Pleasanton number and the least informative this month. The two cleaner signals — $/SqFt and per-tier sale-to-list — both point to a market that is softer than the headline suggests at the middle and tighter than the headline suggests at the top. The headline is the average of those two opposite movements.
Methodology
Historical $/SqFt, monthly closings, and average days on market for Pleasanton detached single-family homes (2007–April 2026) are sourced from the Bay East Association of REALTORS® monthly market reports. May 2026 figures are derived from a Pleasanton MLS detached-sold export covering closings between May 1 and May 29, 2026, filtered to Status = SLD, Building Type = DE (detached), and City = PLEASANTON (n=42, no exclusions). The May 2026 $/SqFt value plotted on the heatmap and trend chart is the simple mean of sale-price-per-square-foot across those 42 closings ($822); it is comparable in methodology to the Bay East “Avg $/SqFt Sold” figure. The April 2026 YoY heatmap cell here uses the Bay East $875 print (now published), which differs slightly from the $897 MLS-export figure cited in the April 2026 post; both are reported, and the difference reflects sample (Bay East includes the Sunol area; the MLS export was Pleasanton-only n=29). Sale-to-list ratio at the city level uses the aggregate convention (sum of sale prices divided by sum of list prices), consistent with the Bay East reporting standard. Per-tier sale-to-list uses the median ratio within the tier. The $/SqFt trend uses a 6-month rolling average; the heatmap uses same-month comparisons without forward-filling missing values. Active listings, pending listings, months supply, and average $/SqFt of active inventory cannot be derived from a sold-only MLS export and are not reported for May 2026 ahead of the Bay East PDF publication.
Work With a Buyer’s Agent Who Reads Beyond the Headline
The single number most Pleasanton buyers and sellers will see this month is the median sale price, up 9.9% year-over-year. That number is correct and almost completely misleading on its own. The decision a buyer or seller needs to make depends on which tier they are in, how their property compares to the carryover cohort, and whether the May tier flip persists into June. Generic market commentary will not answer those questions. Closing-level data will.
Ready to talk through your options? A 30-minute conversation, no obligation, anchored in the May closing data for your specific tier and submarket.
📩 Schedule a Free Buyer Consultation
- Bay East Association of REALTORS® — monthly market reports (Pleasanton, 2007–April 2026)
- Pleasanton MLS detached-sold export, May 2026 (n=42 closed transactions; see methodology)
- Pleasanton April 2026 Market Update
- Pleasanton March 2026 Market Update
- Pleasanton Detached Home Prices by Tier and Story Type
- Pleasanton Home Pricing: 191 Sales Expose the True Cost of Overpricing
- Pleasanton Home Prices Trend & 2027 Forecast
- The Affordability Trap: 18 Years of Pleasanton Price Data
Leave a Reply